AadharHousing AADHARHFC full analysis,charts,indicators,moving averages,SMA,DMA,EMA,ADX,MACD,RSIAadhar Housing AADHARHFC WideScreen charts, DMA,SMA,EMA technical analysis, forecast prediction, by indicators ADX,MACD,RSI,CCI NSE stock exchange
Daily price and charts and targets AadharHousing Strong Daily Stock price targets for AadharHousing AADHARHFC are 508.83 and 515.98 | Daily Target 1 | 506.83 | | Daily Target 2 | 510.82 | | Daily Target 3 | 513.98333333333 | | Daily Target 4 | 517.97 | | Daily Target 5 | 521.13 |
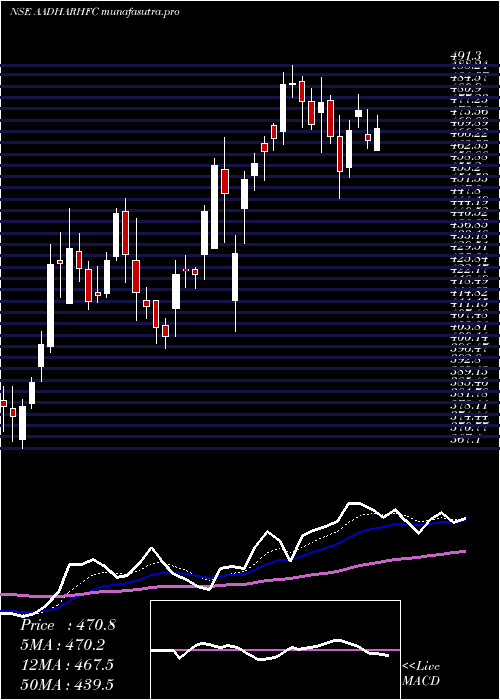
Daily price and volume Aadhar Housing
| Date |
Closing |
Open |
Range |
Volume |
Wed 29 October 2025 |
514.80 (0.55%) |
517.15 |
510.00 - 517.15 |
0.5553 times |
Tue 28 October 2025 |
512.00 (0.16%) |
513.45 |
510.20 - 515.00 |
0.3274 times |
Mon 27 October 2025 |
511.20 (-2.18%) |
525.00 |
510.00 - 525.90 |
0.9308 times |
Fri 24 October 2025 |
522.60 (2.78%) |
509.70 |
506.00 - 525.00 |
1.9044 times |
Thu 23 October 2025 |
508.45 (-1.4%) |
513.00 |
506.15 - 513.65 |
0.6882 times |
Tue 21 October 2025 |
515.65 (0.37%) |
516.45 |
511.70 - 521.05 |
0.2499 times |
Mon 20 October 2025 |
513.75 (2%) |
506.00 |
502.25 - 542.00 |
1.877 times |
Fri 17 October 2025 |
503.70 (-0.87%) |
509.30 |
501.00 - 510.95 |
1.6029 times |
Thu 16 October 2025 |
508.10 (-0.49%) |
514.45 |
506.00 - 514.45 |
1.3544 times |
Wed 15 October 2025 |
510.60 (-1.09%) |
516.00 |
510.00 - 516.20 |
0.5096 times |
Tue 14 October 2025 |
516.25 (0.48%) |
514.00 |
509.15 - 519.00 |
0.7659 times |
Weekly price and charts AadharHousing Strong weekly Stock price targets for AadharHousing AADHARHFC are 504.45 and 520.35 | Weekly Target 1 | 501 | | Weekly Target 2 | 507.9 | | Weekly Target 3 | 516.9 | | Weekly Target 4 | 523.8 | | Weekly Target 5 | 532.8 |
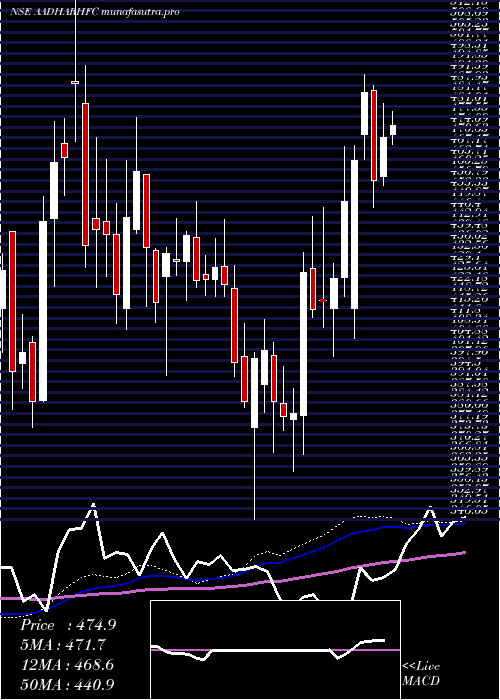
Weekly price and volumes for Aadhar Housing
| Date |
Closing |
Open |
Range |
Volume |
Wed 29 October 2025 |
514.80 (-1.49%) |
525.00 |
510.00 - 525.90 |
0.283 times |
Fri 24 October 2025 |
522.60 (3.75%) |
506.00 |
502.25 - 542.00 |
0.7365 times |
Fri 17 October 2025 |
503.70 (-2.29%) |
514.50 |
501.00 - 519.00 |
0.7269 times |
Fri 10 October 2025 |
515.50 (1.09%) |
509.90 |
506.00 - 527.50 |
0.7856 times |
Fri 03 October 2025 |
509.95 (-0.37%) |
515.00 |
503.45 - 526.00 |
0.7436 times |
Fri 26 September 2025 |
511.85 (-5.06%) |
539.15 |
509.30 - 547.80 |
1.3063 times |
Fri 19 September 2025 |
539.15 (6.41%) |
507.00 |
504.65 - 546.05 |
2.5511 times |
Fri 12 September 2025 |
506.65 (-1.34%) |
510.60 |
497.15 - 522.40 |
0.8017 times |
Fri 05 September 2025 |
513.55 (2.11%) |
500.00 |
495.05 - 520.45 |
1.02 times |
Fri 29 August 2025 |
502.95 (-3.62%) |
524.75 |
495.10 - 530.00 |
1.0452 times |
Fri 22 August 2025 |
521.85 (4.14%) |
504.95 |
497.05 - 523.95 |
1.2186 times |
Monthly price and charts AadharHousing Strong monthly Stock price targets for AadharHousing AADHARHFC are 507.9 and 548.9 | Monthly Target 1 | 478.27 | | Monthly Target 2 | 496.53 | | Monthly Target 3 | 519.26666666667 | | Monthly Target 4 | 537.53 | | Monthly Target 5 | 560.27 |
Monthly price and volumes Aadhar Housing
| Date |
Closing |
Open |
Range |
Volume |
Wed 29 October 2025 |
514.80 (0.89%) |
512.65 |
501.00 - 542.00 |
0.4749 times |
Tue 30 September 2025 |
510.25 (1.45%) |
500.00 |
495.05 - 547.80 |
0.94 times |
Fri 29 August 2025 |
502.95 (-0.81%) |
507.00 |
491.00 - 530.00 |
0.6607 times |
Thu 31 July 2025 |
507.05 (11.54%) |
455.15 |
447.00 - 537.50 |
2.2582 times |
Mon 30 June 2025 |
454.60 (2.33%) |
445.00 |
411.30 - 460.90 |
0.5844 times |
Fri 30 May 2025 |
444.25 (-4.88%) |
463.80 |
426.45 - 479.45 |
0.6924 times |
Wed 30 April 2025 |
467.05 (9.93%) |
424.95 |
405.00 - 491.30 |
1.1401 times |
Fri 28 March 2025 |
424.85 (11.6%) |
379.95 |
367.10 - 447.95 |
1.4888 times |
Fri 28 February 2025 |
380.70 (-4.47%) |
390.00 |
361.60 - 411.50 |
0.8344 times |
Fri 31 January 2025 |
398.50 (-5.7%) |
422.95 |
346.05 - 443.85 |
0.9259 times |
Tue 31 December 2024 |
422.60 (-2.35%) |
431.10 |
417.70 - 449.95 |
0.8616 times |
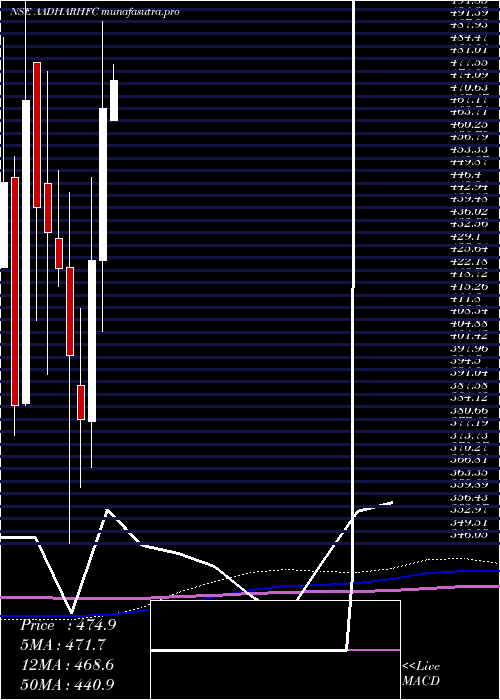
DMA SMA EMA moving averages of Aadhar Housing AADHARHFC
DMA (daily moving average) of Aadhar Housing AADHARHFC
| DMA period | DMA value | | 5 day DMA | 513.81 | | 12 day DMA | 512.58 | | 20 day DMA | 512.72 | | 35 day DMA | 517.78 | | 50 day DMA | 515.22 | | 100 day DMA | 494.85 | | 150 day DMA | 479.77 | | 200 day DMA | 459.42 | EMA (exponential moving average) of Aadhar Housing AADHARHFC
| EMA period | EMA current | EMA prev | EMA prev2 | | 5 day EMA | 513.67 | 513.1 | 513.65 | | 12 day EMA | 513.51 | 513.28 | 513.51 | | 20 day EMA | 514.09 | 514.02 | 514.23 | | 35 day EMA | 513.5 | 513.42 | 513.5 | | 50 day EMA | 514.08 | 514.05 | 514.13 |
SMA (simple moving average) of Aadhar Housing AADHARHFC
| SMA period | SMA current | SMA prev | SMA prev2 | | 5 day SMA | 513.81 | 513.98 | 514.33 | | 12 day SMA | 512.58 | 512.63 | 512.78 | | 20 day SMA | 512.72 | 512.55 | 512.55 | | 35 day SMA | 517.78 | 517.65 | 517.7 | | 50 day SMA | 515.22 | 514.94 | 514.64 | | 100 day SMA | 494.85 | 494.14 | 493.43 | | 150 day SMA | 479.77 | 479.2 | 478.74 | | 200 day SMA | 459.42 | 458.96 | 458.51 |
|
|
