SecRed 9SCL26BA_NA full analysis,charts,indicators,moving averages,SMA,DMA,EMA,ADX,MACD,RSISec Red 9SCL26BA_NA WideScreen charts, DMA,SMA,EMA technical analysis, forecast prediction, by indicators ADX,MACD,RSI,CCI NSE stock exchange
Daily price and charts and targets SecRed Strong Daily Stock price targets for SecRed 9SCL26BA_NA are 992.1 and 992.1 | Daily Target 1 | 992.1 | | Daily Target 2 | 992.1 | | Daily Target 3 | 992.1 | | Daily Target 4 | 992.1 | | Daily Target 5 | 992.1 |
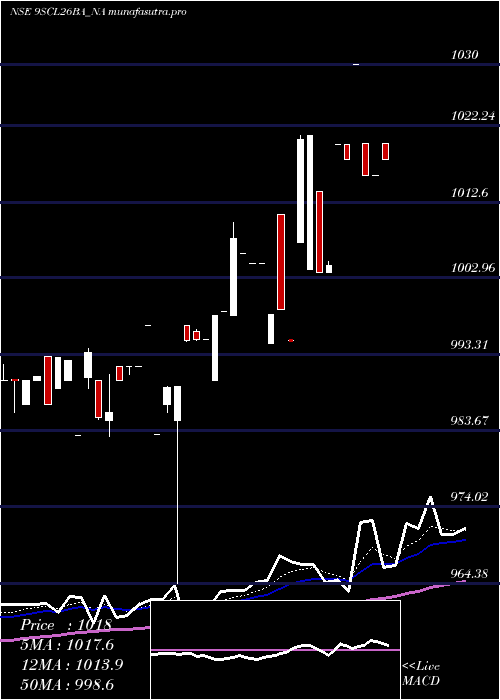
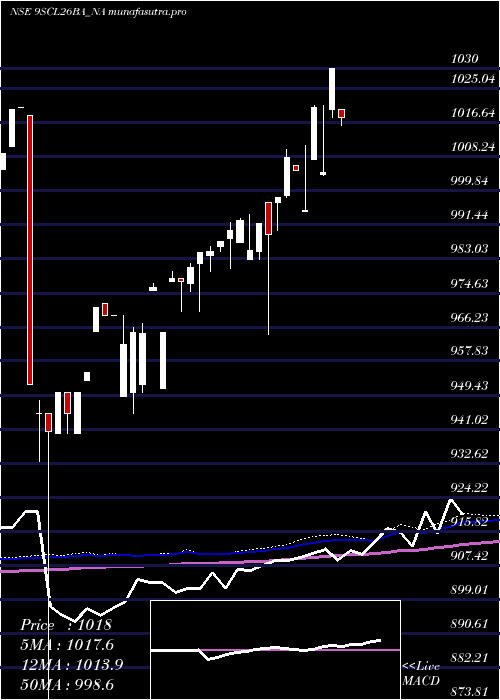
Daily price and volume Sec Red
| Date |
Closing |
Open |
Range |
Volume |
Tue 28 October 2025 |
992.10 (0.01%) |
992.10 |
992.10 - 992.10 |
1.1347 times |
Mon 27 October 2025 |
992.00 (0.71%) |
990.00 |
990.00 - 992.00 |
0.7416 times |
Fri 24 October 2025 |
985.00 (-0.2%) |
987.00 |
985.00 - 987.00 |
0.3596 times |
Thu 23 October 2025 |
987.00 (0.34%) |
972.20 |
972.20 - 997.50 |
2.9997 times |
Tue 21 October 2025 |
983.68 (-0.64%) |
990.00 |
982.00 - 990.00 |
0.5576 times |
Mon 20 October 2025 |
990.00 (0.51%) |
980.80 |
980.80 - 990.00 |
1.327 times |
Fri 17 October 2025 |
985.00 (0.2%) |
985.00 |
985.00 - 985.00 |
0.2509 times |
Thu 16 October 2025 |
983.00 (0.3%) |
988.00 |
983.00 - 988.00 |
1.3967 times |
Wed 15 October 2025 |
980.05 (-0.5%) |
978.00 |
978.00 - 985.00 |
1.0454 times |
Tue 14 October 2025 |
985.00 (0.41%) |
985.00 |
985.00 - 985.00 |
0.1868 times |
Mon 13 October 2025 |
981.00 (-0.3%) |
980.00 |
980.00 - 981.00 |
0.3067 times |
Weekly price and charts SecRed Strong weekly Stock price targets for SecRed 9SCL26BA_NA are 991.05 and 993.15 | Weekly Target 1 | 989.3 | | Weekly Target 2 | 990.7 | | Weekly Target 3 | 991.4 | | Weekly Target 4 | 992.8 | | Weekly Target 5 | 993.5 |
Weekly price and volumes for Sec Red
| Date |
Closing |
Open |
Range |
Volume |
Tue 28 October 2025 |
992.10 (0.72%) |
990.00 |
990.00 - 992.10 |
0.3532 times |
Fri 24 October 2025 |
985.00 (0%) |
980.80 |
972.20 - 997.50 |
0.987 times |
Fri 17 October 2025 |
985.00 (0.1%) |
980.00 |
978.00 - 988.00 |
0.5998 times |
Fri 10 October 2025 |
984.00 (-0.1%) |
985.50 |
966.22 - 993.99 |
0.5321 times |
Fri 03 October 2025 |
985.00 (1.03%) |
975.00 |
970.50 - 994.81 |
0.5867 times |
Fri 26 September 2025 |
975.00 (-0.13%) |
976.55 |
970.00 - 1012.80 |
1.3187 times |
Fri 19 September 2025 |
976.31 (0.18%) |
975.00 |
972.55 - 985.06 |
2.662 times |
Fri 12 September 2025 |
974.54 (-7.77%) |
1060.50 |
972.00 - 1062.50 |
0.9996 times |
Fri 05 September 2025 |
1056.59 (-0.3%) |
1057.99 |
1051.00 - 1062.50 |
1.5585 times |
Thu 28 August 2025 |
1059.80 (-0.02%) |
1060.00 |
1045.26 - 1062.50 |
0.4025 times |
Fri 22 August 2025 |
1060.00 (0.47%) |
1055.00 |
1040.56 - 1064.75 |
0.3054 times |
Monthly price and charts SecRed Strong monthly Stock price targets for SecRed 9SCL26BA_NA are 979.16 and 1010.44 | Monthly Target 1 | 953.99 | | Monthly Target 2 | 973.05 | | Monthly Target 3 | 985.27333333333 | | Monthly Target 4 | 1004.33 | | Monthly Target 5 | 1016.55 |
Monthly price and volumes Sec Red
| Date |
Closing |
Open |
Range |
Volume |
Tue 28 October 2025 |
992.10 (1.96%) |
984.00 |
966.22 - 997.50 |
0.5771 times |
Tue 30 September 2025 |
973.00 (-8.19%) |
1057.99 |
970.00 - 1062.50 |
1.4882 times |
Thu 28 August 2025 |
1059.80 (1.23%) |
1048.90 |
1040.56 - 1064.75 |
0.3261 times |
Thu 31 July 2025 |
1046.95 (0.86%) |
1039.00 |
950.00 - 1055.00 |
1.2897 times |
Mon 30 June 2025 |
1038.00 (1.17%) |
1025.00 |
1022.02 - 1039.99 |
1.6991 times |
Fri 30 May 2025 |
1026.00 (0.79%) |
1030.00 |
1015.00 - 1030.00 |
1.0057 times |
Wed 30 April 2025 |
1018.00 (0.99%) |
1006.00 |
994.77 - 1021.00 |
0.2348 times |
Wed 26 March 2025 |
1008.00 (2.31%) |
985.00 |
964.38 - 1010.00 |
0.4797 times |
Fri 28 February 2025 |
985.23 (0.02%) |
986.00 |
980.60 - 993.99 |
1.3098 times |
Fri 31 January 2025 |
985.00 (2.07%) |
977.40 |
970.00 - 986.00 |
1.5898 times |
Fri 27 December 2024 |
965.00 (0.31%) |
950.05 |
945.00 - 977.05 |
4.1048 times |

DMA SMA EMA moving averages of Sec Red 9SCL26BA_NA
DMA (daily moving average) of Sec Red 9SCL26BA_NA
| DMA period | DMA value | | 5 day DMA | 987.96 | | 12 day DMA | 985.65 | | 20 day DMA | 984.72 | | 35 day DMA | 990.36 | | 50 day DMA | 1009.09 | | 100 day DMA | 1021.23 | | 150 day DMA | 1013.97 | | 200 day DMA | 1002.23 | EMA (exponential moving average) of Sec Red 9SCL26BA_NA
| EMA period | EMA current | EMA prev | EMA prev2 | | 5 day EMA | 989.14 | 987.66 | 985.49 | | 12 day EMA | 987.15 | 986.25 | 985.21 | | 20 day EMA | 988.35 | 987.95 | 987.52 | | 35 day EMA | 999.26 | 999.68 | 1000.13 | | 50 day EMA | 1010.07 | 1010.8 | 1011.57 |
SMA (simple moving average) of Sec Red 9SCL26BA_NA
| SMA period | SMA current | SMA prev | SMA prev2 | | 5 day SMA | 987.96 | 987.54 | 986.14 | | 12 day SMA | 985.65 | 984.98 | 985.14 | | 20 day SMA | 984.72 | 983.63 | 982.53 | | 35 day SMA | 990.36 | 992.27 | 994.1 | | 50 day SMA | 1009.09 | 1010.19 | 1011.29 | | 100 day SMA | 1021.23 | 1021.51 | 1021.79 | | 150 day SMA | 1013.97 | 1013.92 | 1013.88 | | 200 day SMA | 1002.23 | 1001.99 | 1001.78 |
|
|
