SecRe 9IIFL28_Y0 full analysis,charts,indicators,moving averages,SMA,DMA,EMA,ADX,MACD,RSISec Re 9IIFL28_Y0 WideScreen charts, DMA,SMA,EMA technical analysis, forecast prediction, by indicators ADX,MACD,RSI,CCI NSE stock exchange
Daily price and charts and targets SecRe Strong Daily Stock price targets for SecRe 9IIFL28_Y0 are 975.5 and 975.5 | Daily Target 1 | 975.5 | | Daily Target 2 | 975.5 | | Daily Target 3 | 975.5 | | Daily Target 4 | 975.5 | | Daily Target 5 | 975.5 |
Daily price and volume Sec Re
| Date |
Closing |
Open |
Range |
Volume |
Fri 11 July 2025 |
975.50 (-0.05%) |
975.50 |
975.50 - 975.50 |
2.0301 times |
Tue 08 July 2025 |
976.00 (0.1%) |
976.00 |
976.00 - 976.00 |
0.1654 times |
Mon 07 July 2025 |
975.00 (-0.1%) |
975.00 |
975.00 - 975.00 |
0.782 times |
Fri 04 July 2025 |
976.00 (0.1%) |
975.00 |
975.00 - 976.00 |
0.9323 times |
Thu 03 July 2025 |
975.05 (1.56%) |
975.05 |
975.05 - 975.05 |
0.015 times |
Wed 02 July 2025 |
960.05 (-1.03%) |
970.00 |
960.05 - 971.00 |
3.7594 times |
Tue 01 July 2025 |
970.00 (-1.02%) |
976.00 |
970.00 - 980.00 |
0.7669 times |
Tue 24 June 2025 |
980.00 (0%) |
980.00 |
980.00 - 980.00 |
0.2707 times |
Fri 20 June 2025 |
980.00 (-0.08%) |
980.00 |
980.00 - 980.00 |
0.0752 times |
Fri 13 June 2025 |
980.80 (-0.93%) |
983.00 |
980.00 - 983.00 |
1.203 times |
Thu 12 June 2025 |
990.00 (-4.22%) |
999.80 |
990.00 - 999.80 |
0.6015 times |

Weekly price and charts SecRe Strong weekly Stock price targets for SecRe 9IIFL28_Y0 are 975.25 and 976.25 | Weekly Target 1 | 974.5 | | Weekly Target 2 | 975 | | Weekly Target 3 | 975.5 | | Weekly Target 4 | 976 | | Weekly Target 5 | 976.5 |
Weekly price and volumes for Sec Re
| Date |
Closing |
Open |
Range |
Volume |
Fri 11 July 2025 |
975.50 (-0.05%) |
975.00 |
975.00 - 976.00 |
0.3713 times |
Fri 04 July 2025 |
976.00 (-0.41%) |
976.00 |
960.05 - 980.00 |
0.6827 times |
Tue 24 June 2025 |
980.00 (0%) |
980.00 |
980.00 - 980.00 |
0.0338 times |
Fri 20 June 2025 |
980.00 (-0.08%) |
980.00 |
980.00 - 980.00 |
0.0094 times |
Fri 13 June 2025 |
980.80 (-3.58%) |
1026.20 |
980.00 - 1033.60 |
0.2494 times |
Wed 21 May 2025 |
1017.20 (-0.32%) |
1022.29 |
1017.20 - 1022.29 |
0.9752 times |
Fri 16 May 2025 |
1020.51 (-0.04%) |
1021.70 |
1008.00 - 1021.79 |
4.2479 times |
Fri 02 May 2025 |
1020.90 (0.09%) |
1020.00 |
1020.00 - 1020.90 |
0.0413 times |
Fri 25 April 2025 |
1020.00 (1.67%) |
1005.50 |
1003.21 - 1022.75 |
1.6635 times |
Thu 17 April 2025 |
1003.21 (0.6%) |
1001.00 |
1000.00 - 1003.21 |
1.7254 times |
Wed 02 April 2025 |
997.20 (-0.28%) |
997.20 |
997.20 - 997.20 |
0.0188 times |
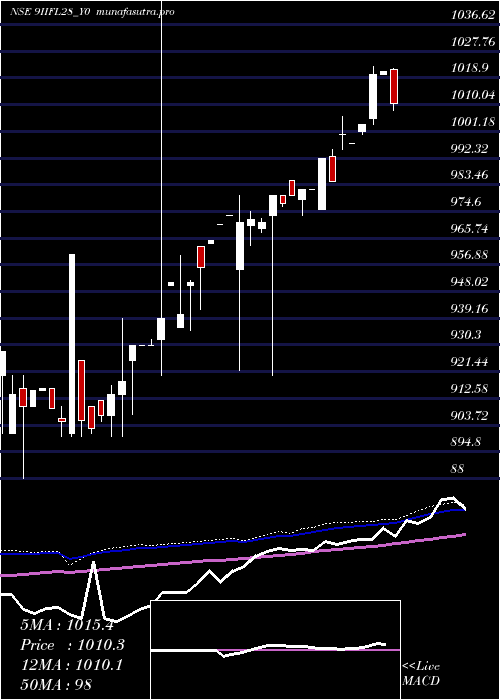
Monthly price and charts SecRe Strong monthly Stock price targets for SecRe 9IIFL28_Y0 are 957.8 and 977.75 | Monthly Target 1 | 951.9 | | Monthly Target 2 | 963.7 | | Monthly Target 3 | 971.85 | | Monthly Target 4 | 983.65 | | Monthly Target 5 | 991.8 |
Monthly price and volumes Sec Re
| Date |
Closing |
Open |
Range |
Volume |
Fri 11 July 2025 |
975.50 (-0.46%) |
976.00 |
960.05 - 980.00 |
0.3287 times |
Tue 24 June 2025 |
980.00 (-3.66%) |
1026.20 |
980.00 - 1033.60 |
0.0912 times |
Wed 21 May 2025 |
1017.20 (-0.31%) |
1020.90 |
1008.00 - 1022.29 |
1.6346 times |
Wed 30 April 2025 |
1020.33 (2.03%) |
997.20 |
997.20 - 1022.75 |
1.0697 times |
Fri 28 March 2025 |
1000.00 (0.81%) |
992.95 |
984.60 - 1006.00 |
0.5714 times |
Fri 28 February 2025 |
992.00 (1.22%) |
978.40 |
973.20 - 992.00 |
1.2264 times |
Fri 31 January 2025 |
980.00 (0.56%) |
974.50 |
920.00 - 985.00 |
1.5878 times |
Tue 31 December 2024 |
974.50 (1.96%) |
964.00 |
922.00 - 980.00 |
2.0779 times |
Fri 29 November 2024 |
955.80 (1.79%) |
950.00 |
935.21 - 963.00 |
0.8597 times |
Thu 31 October 2024 |
939.00 (1.49%) |
907.20 |
907.20 - 1099.99 |
0.5527 times |
Mon 23 September 2024 |
925.20 (2.01%) |
907.00 |
900.00 - 939.00 |
1.0925 times |
DMA SMA EMA moving averages of Sec Re 9IIFL28_Y0
DMA (daily moving average) of Sec Re 9IIFL28_Y0
| DMA period | DMA value | | 5 day DMA | 975.51 | | 12 day DMA | 981 | | 20 day DMA | 996.56 | | 35 day DMA | 998.06 | | 50 day DMA | 992.47 | | 100 day DMA | 966.24 | | 150 day DMA | | | 200 day DMA | | EMA (exponential moving average) of Sec Re 9IIFL28_Y0
| EMA period | EMA current | EMA prev | EMA prev2 | | 5 day EMA | 975.57 | 975.6 | 975.4 | | 12 day EMA | 982.03 | 983.22 | 984.53 | | 20 day EMA | 987.59 | 988.86 | 990.21 | | 35 day EMA | 988.83 | 989.61 | 990.41 | | 50 day EMA | 988.27 | 988.79 | 989.31 |
SMA (simple moving average) of Sec Re 9IIFL28_Y0
| SMA period | SMA current | SMA prev | SMA prev2 | | 5 day SMA | 975.51 | 972.42 | 971.22 | | 12 day SMA | 981 | 985.23 | 988.66 | | 20 day SMA | 996.56 | 998.78 | 1000.63 | | 35 day SMA | 998.06 | 998.09 | 998.32 | | 50 day SMA | 992.47 | 991.56 | 991.46 | | 100 day SMA | 966.24 | 965.53 | 964.78 | | 150 day SMA | | 200 day SMA |
|
|
