SecRe 990SCL26_N7 full analysis,charts,indicators,moving averages,SMA,DMA,EMA,ADX,MACD,RSISec Re 990SCL26_N7 WideScreen charts, DMA,SMA,EMA technical analysis, forecast prediction, by indicators ADX,MACD,RSI,CCI NSE stock exchange
Daily price and charts and targets SecRe Strong Daily Stock price targets for SecRe 990SCL26_N7 are 695 and 705 | Daily Target 1 | 693.33 | | Daily Target 2 | 696.67 | | Daily Target 3 | 703.33333333333 | | Daily Target 4 | 706.67 | | Daily Target 5 | 713.33 |
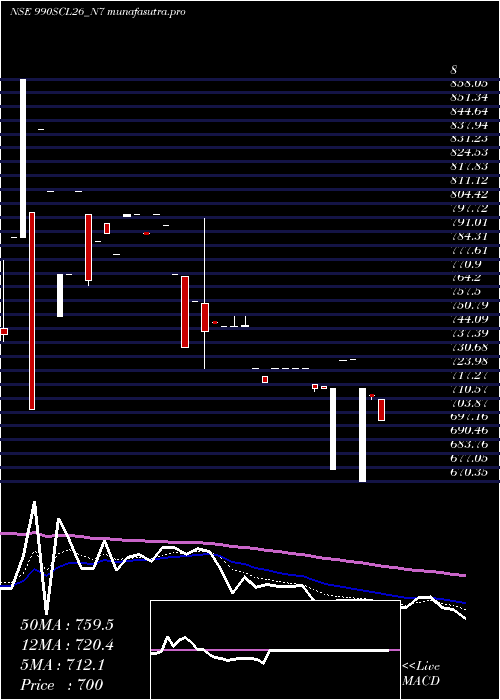
Daily price and volume Sec Re
| Date |
Closing |
Open |
Range |
Volume |
Fri 23 May 2025 |
700.00 (-1.67%) |
710.00 |
700.00 - 710.00 |
0.7602 times |
Thu 22 May 2025 |
711.90 (-0.43%) |
712.00 |
710.00 - 712.00 |
0.4094 times |
Fri 16 May 2025 |
715.00 (-1.92%) |
670.35 |
670.35 - 715.00 |
0.3899 times |
Mon 12 May 2025 |
729.00 (0.03%) |
729.00 |
729.00 - 729.00 |
0.1949 times |
Tue 29 April 2025 |
728.80 (1.93%) |
728.70 |
728.70 - 728.80 |
4.8733 times |
Tue 22 April 2025 |
715.00 (0%) |
676.00 |
676.00 - 715.00 |
0.2339 times |
Wed 16 April 2025 |
715.00 (0%) |
716.00 |
715.00 - 716.00 |
0.2339 times |
Tue 01 April 2025 |
715.00 (-1.38%) |
717.00 |
714.00 - 717.00 |
0.2339 times |
Thu 06 March 2025 |
725.00 (0%) |
725.00 |
725.00 - 725.00 |
0.9162 times |
Fri 28 February 2025 |
725.00 (0%) |
725.00 |
725.00 - 725.00 |
1.7544 times |
Thu 27 February 2025 |
725.00 (0%) |
725.00 |
725.00 - 725.00 |
1.54 times |
Weekly price and charts SecRe Strong weekly Stock price targets for SecRe 990SCL26_N7 are 694 and 706 | Weekly Target 1 | 692 | | Weekly Target 2 | 696 | | Weekly Target 3 | 704 | | Weekly Target 4 | 708 | | Weekly Target 5 | 716 |
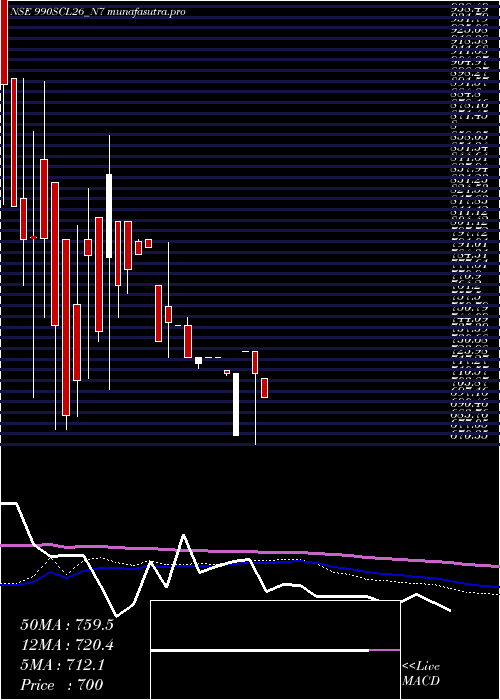
Weekly price and volumes for Sec Re
| Date |
Closing |
Open |
Range |
Volume |
Fri 23 May 2025 |
700.00 (-2.1%) |
712.00 |
700.00 - 712.00 |
0.4468 times |
Fri 16 May 2025 |
715.00 (-1.89%) |
729.00 |
670.35 - 729.00 |
0.2234 times |
Tue 29 April 2025 |
728.80 (1.93%) |
728.70 |
728.70 - 728.80 |
1.8615 times |
Tue 22 April 2025 |
715.00 (0%) |
676.00 |
676.00 - 715.00 |
0.0894 times |
Wed 16 April 2025 |
715.00 (-1.38%) |
717.00 |
714.00 - 717.00 |
0.1787 times |
Thu 06 March 2025 |
725.00 (0%) |
725.00 |
725.00 - 725.00 |
0.35 times |
Fri 28 February 2025 |
725.00 (0%) |
725.00 |
725.00 - 725.00 |
1.2584 times |
Thu 20 February 2025 |
724.99 (-0%) |
721.00 |
718.00 - 725.00 |
0.9531 times |
Thu 23 January 2025 |
725.00 (-2.68%) |
745.00 |
725.00 - 750.00 |
4.6314 times |
Tue 14 January 2025 |
745.00 (-0.27%) |
745.00 |
745.00 - 745.00 |
0.0074 times |
Fri 10 January 2025 |
747.00 (1.63%) |
756.99 |
725.00 - 797.00 |
1.4296 times |
Monthly price and charts SecRe Strong monthly Stock price targets for SecRe 990SCL26_N7 are 655.85 and 714.5 | Monthly Target 1 | 641.13 | | Monthly Target 2 | 670.57 | | Monthly Target 3 | 699.78333333333 | | Monthly Target 4 | 729.22 | | Monthly Target 5 | 758.43 |
Monthly price and volumes Sec Re
| Date |
Closing |
Open |
Range |
Volume |
Fri 23 May 2025 |
700.00 (-3.95%) |
729.00 |
670.35 - 729.00 |
0.0906 times |
Tue 29 April 2025 |
728.80 (0.52%) |
717.00 |
676.00 - 728.80 |
0.288 times |
Thu 06 March 2025 |
725.00 (0%) |
725.00 |
725.00 - 725.00 |
0.0473 times |
Fri 28 February 2025 |
725.00 (0%) |
721.00 |
718.00 - 725.00 |
0.2991 times |
Thu 23 January 2025 |
725.00 (-5.84%) |
769.00 |
725.00 - 797.00 |
1.0311 times |
Tue 31 December 2024 |
770.00 (-0.03%) |
810.00 |
765.00 - 810.00 |
0.6626 times |
Thu 28 November 2024 |
770.20 (8.43%) |
749.00 |
705.00 - 864.00 |
1.1217 times |
Thu 31 October 2024 |
710.29 (-4.73%) |
801.00 |
680.00 - 898.00 |
5.5342 times |
Mon 30 September 2024 |
745.54 (-25.46%) |
1040.20 |
700.20 - 1150.00 |
0.8972 times |
Wed 28 August 2024 |
1000.20 (0%) |
1035.30 |
1000.20 - 1050.10 |
0.0282 times |
Sat 24 May 2025 |
(0%) |
|
- |
0 times |

DMA SMA EMA moving averages of Sec Re 990SCL26_N7
DMA (daily moving average) of Sec Re 990SCL26_N7
| DMA period | DMA value | | 5 day DMA | 716.94 | | 12 day DMA | 719.14 | | 20 day DMA | 727.75 | | 35 day DMA | 752.13 | | 50 day DMA | 754.56 | | 100 day DMA | | | 150 day DMA | | | 200 day DMA | | EMA (exponential moving average) of Sec Re 990SCL26_N7
| EMA period | EMA current | EMA prev | EMA prev2 | | 5 day EMA | 712.05 | 718.08 | 721.17 | | 12 day EMA | 720.37 | 724.07 | 726.28 | | 20 day EMA | 728.45 | 731.44 | 733.5 | | 35 day EMA | 736.12 | 738.25 | 739.8 | | 50 day EMA | 746.34 | 748.23 | 749.71 |
SMA (simple moving average) of Sec Re 990SCL26_N7
| SMA period | SMA current | SMA prev | SMA prev2 | | 5 day SMA | 716.94 | 719.94 | 720.56 | | 12 day SMA | 719.14 | 720.64 | 721.73 | | 20 day SMA | 727.75 | 729.5 | 732.41 | | 35 day SMA | 752.13 | 756.13 | 755.93 | | 50 day SMA | 754.56 | 754.36 | 753.92 | | 100 day SMA | | 150 day SMA | | 200 day SMA |
|
|
