Scl9 965SCL26Y_N1 full analysis,charts,indicators,moving averages,SMA,DMA,EMA,ADX,MACD,RSIScl 9 965SCL26Y_N1 WideScreen charts, DMA,SMA,EMA technical analysis, forecast prediction, by indicators ADX,MACD,RSI,CCI NSE stock exchange
Daily price and charts and targets Scl9 Strong Daily Stock price targets for Scl9 965SCL26Y_N1 are 1062.2 and 1062.2 | Daily Target 1 | 1062.2 | | Daily Target 2 | 1062.2 | | Daily Target 3 | 1062.2 | | Daily Target 4 | 1062.2 | | Daily Target 5 | 1062.2 |
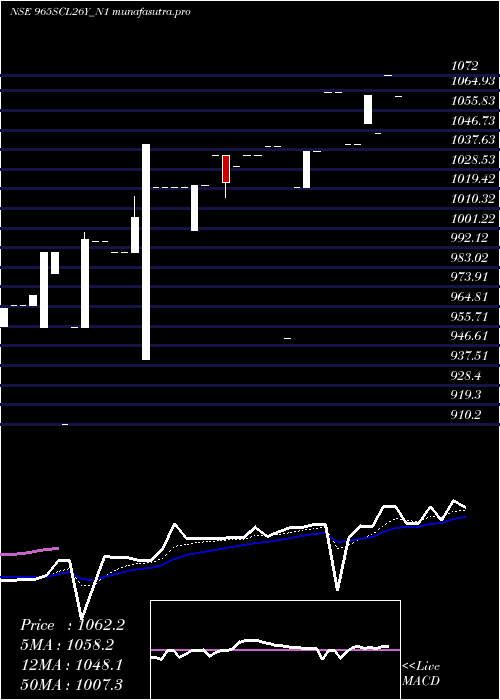
Daily price and volume Scl 9
| Date |
Closing |
Open |
Range |
Volume |
Wed 10 December 2025 |
1062.20 (-0.91%) |
1062.20 |
1062.20 - 1062.20 |
0.2695 times |
Tue 09 December 2025 |
1072.00 (2.56%) |
1072.00 |
1072.00 - 1072.00 |
1.3477 times |
Tue 25 November 2025 |
1045.20 (-1.67%) |
1045.20 |
1045.20 - 1045.20 |
0.027 times |
Fri 21 November 2025 |
1063.00 (2.19%) |
1050.00 |
1050.00 - 1063.00 |
1.0782 times |
Thu 13 November 2025 |
1040.20 (0%) |
1040.20 |
1040.20 - 1040.20 |
0.2695 times |
Tue 11 November 2025 |
1040.20 (-2.24%) |
1040.20 |
1040.20 - 1040.20 |
0.2695 times |
Thu 06 November 2025 |
1064.00 (0%) |
1064.00 |
1064.00 - 1064.00 |
0.2695 times |
Wed 29 October 2025 |
1064.00 (2.6%) |
1064.00 |
1064.00 - 1064.00 |
1.3477 times |
Mon 20 October 2025 |
1037.00 (0%) |
1037.00 |
1037.00 - 1037.00 |
4.5822 times |
Mon 13 October 2025 |
1037.00 (1.67%) |
1020.00 |
1020.00 - 1037.00 |
0.5391 times |
Wed 08 October 2025 |
1020.00 (7.35%) |
1020.00 |
1020.00 - 1020.00 |
0.1078 times |
Weekly price and charts Scl9 Strong weekly Stock price targets for Scl9 965SCL26Y_N1 are 1057.3 and 1067.1 | Weekly Target 1 | 1055.67 | | Weekly Target 2 | 1058.93 | | Weekly Target 3 | 1065.4666666667 | | Weekly Target 4 | 1068.73 | | Weekly Target 5 | 1075.27 |
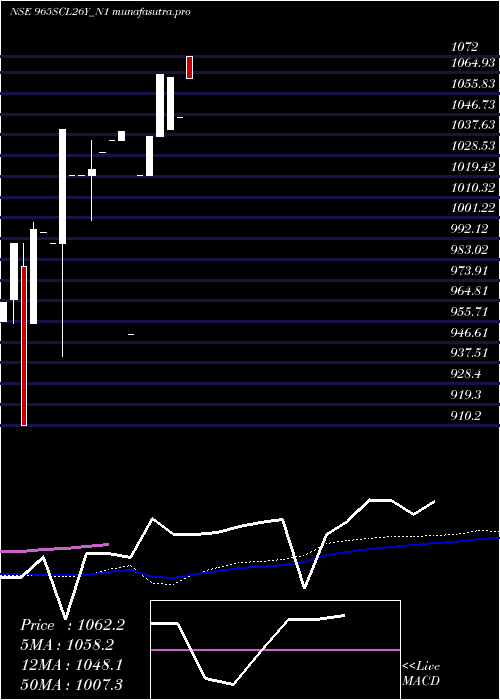
Weekly price and volumes for Scl 9
| Date |
Closing |
Open |
Range |
Volume |
Wed 10 December 2025 |
1062.20 (1.63%) |
1072.00 |
1062.20 - 1072.00 |
1.2397 times |
Tue 25 November 2025 |
1045.20 (-1.67%) |
1045.20 |
1045.20 - 1045.20 |
0.0207 times |
Fri 21 November 2025 |
1063.00 (-0.09%) |
1040.20 |
1040.20 - 1063.00 |
1.2397 times |
Thu 06 November 2025 |
1064.00 (2.6%) |
1037.00 |
1037.00 - 1064.00 |
4.7521 times |
Mon 13 October 2025 |
1037.00 (1.67%) |
1020.00 |
1020.00 - 1037.00 |
0.4132 times |
Wed 08 October 2025 |
1020.00 (7.35%) |
1020.00 |
1020.00 - 1020.00 |
0.0826 times |
Wed 03 September 2025 |
950.20 (-8.55%) |
950.20 |
950.20 - 950.20 |
0.186 times |
Thu 14 August 2025 |
1039.00 (0.39%) |
1035.00 |
1035.00 - 1039.00 |
1.0331 times |
Wed 06 August 2025 |
1035.00 (0.49%) |
1035.00 |
1035.00 - 1035.00 |
0.4132 times |
Wed 30 July 2025 |
1030.00 (0.73%) |
1030.00 |
1030.00 - 1030.00 |
0.6198 times |
Fri 25 July 2025 |
1022.55 (0.25%) |
1020.00 |
1000.00 - 1035.00 |
7.3347 times |
Monthly price and charts Scl9 Strong monthly Stock price targets for Scl9 965SCL26Y_N1 are 1057.3 and 1067.1 | Monthly Target 1 | 1055.67 | | Monthly Target 2 | 1058.93 | | Monthly Target 3 | 1065.4666666667 | | Monthly Target 4 | 1068.73 | | Monthly Target 5 | 1075.27 |
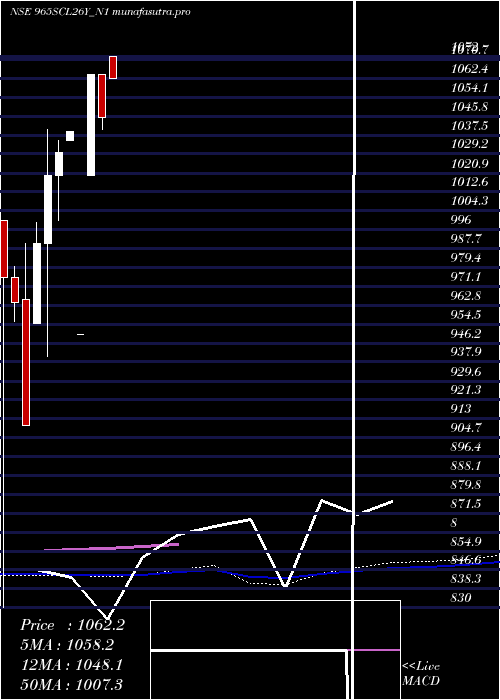
Monthly price and volumes Scl 9
| Date |
Closing |
Open |
Range |
Volume |
Wed 10 December 2025 |
1062.20 (1.63%) |
1072.00 |
1062.20 - 1072.00 |
0.4769 times |
Tue 25 November 2025 |
1045.20 (-1.77%) |
1064.00 |
1040.20 - 1064.00 |
0.5644 times |
Wed 29 October 2025 |
1064.00 (11.98%) |
1020.00 |
1020.00 - 1064.00 |
1.9396 times |
Wed 03 September 2025 |
950.20 (-8.55%) |
950.20 |
950.20 - 950.20 |
0.0715 times |
Thu 14 August 2025 |
1039.00 (0.87%) |
1035.00 |
1035.00 - 1039.00 |
0.5564 times |
Wed 30 July 2025 |
1030.00 (0.98%) |
1020.00 |
1000.00 - 1035.00 |
3.2194 times |
Mon 23 June 2025 |
1020.00 (3.03%) |
990.00 |
940.30 - 1040.00 |
0.5962 times |
Wed 21 May 2025 |
990.00 (8.77%) |
955.00 |
955.00 - 999.00 |
0.6757 times |
Wed 12 March 2025 |
910.20 (-5.58%) |
965.22 |
910.20 - 990.00 |
0.9459 times |
Thu 13 February 2025 |
963.96 (-1.13%) |
975.00 |
955.50 - 980.00 |
0.9539 times |
Thu 30 January 2025 |
975.00 (0%) |
1000.00 |
830.00 - 1000.00 |
1.3831 times |
DMA SMA EMA moving averages of Scl 9 965SCL26Y_N1
DMA (daily moving average) of Scl 9 965SCL26Y_N1
| DMA period | DMA value | | 5 day DMA | 1056.52 | | 12 day DMA | 1041.25 | | 20 day DMA | 1037.58 | | 35 day DMA | 1020.56 | | 50 day DMA | 1006.17 | | 100 day DMA | | | 150 day DMA | | | 200 day DMA | | EMA (exponential moving average) of Scl 9 965SCL26Y_N1
| EMA period | EMA current | EMA prev | EMA prev2 | | 5 day EMA | 1058.18 | 1056.17 | 1048.26 | | 12 day EMA | 1048.09 | 1045.53 | 1040.72 | | 20 day EMA | 1038.77 | 1036.3 | 1032.54 | | 35 day EMA | 1022.45 | 1020.11 | 1017.06 | | 50 day EMA | 1007.25 | 1005.01 | 1002.28 |
SMA (simple moving average) of Scl 9 965SCL26Y_N1
| SMA period | SMA current | SMA prev | SMA prev2 | | 5 day SMA | 1056.52 | 1052.12 | 1050.52 | | 12 day SMA | 1041.25 | 1039.32 | 1036.57 | | 20 day SMA | 1037.58 | 1035.52 | 1032.92 | | 35 day SMA | 1020.56 | 1018.5 | 1015.58 | | 50 day SMA | 1006.17 | 1003.53 | 1000.69 | | 100 day SMA | | 150 day SMA | | 200 day SMA |
|
|
