SecRed 957NIDO26_N5 full analysis,charts,indicators,moving averages,SMA,DMA,EMA,ADX,MACD,RSISec Red 957NIDO26_N5 WideScreen charts, DMA,SMA,EMA technical analysis, forecast prediction, by indicators ADX,MACD,RSI,CCI NSE stock exchange
Daily price and charts and targets SecRed Strong Daily Stock price targets for SecRed 957NIDO26_N5 are 979 and 979 | Daily Target 1 | 979 | | Daily Target 2 | 979 | | Daily Target 3 | 979 | | Daily Target 4 | 979 | | Daily Target 5 | 979 |
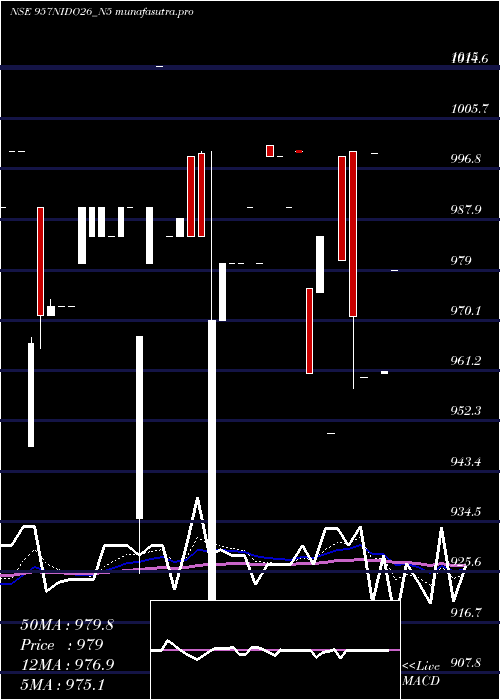
Daily price and volume Sec Red
| Date |
Closing |
Open |
Range |
Volume |
Thu 17 April 2025 |
979.00 (1.87%) |
979.00 |
979.00 - 979.00 |
0.0669 times |
Wed 09 April 2025 |
961.06 (-3.85%) |
960.70 |
960.70 - 961.06 |
0.6961 times |
Tue 08 April 2025 |
999.50 (4.11%) |
999.50 |
999.50 - 999.50 |
0.3347 times |
Mon 07 April 2025 |
960.00 (-1.1%) |
960.00 |
960.00 - 960.00 |
1.004 times |
Fri 04 April 2025 |
970.69 (-1.01%) |
1000.00 |
958.00 - 1000.00 |
0.8701 times |
Wed 02 April 2025 |
980.60 (3.22%) |
999.00 |
980.60 - 999.00 |
2.075 times |
Tue 01 April 2025 |
950.00 (-3.55%) |
950.00 |
950.00 - 950.00 |
1.8005 times |
Wed 26 March 2025 |
985.00 (2.54%) |
975.00 |
975.00 - 985.00 |
1.7001 times |
Tue 25 March 2025 |
960.60 (-3.93%) |
975.60 |
960.60 - 975.60 |
0.6158 times |
Mon 24 March 2025 |
999.90 (1%) |
1000.00 |
999.90 - 1000.00 |
0.8367 times |
Thu 20 March 2025 |
990.00 (-0.9%) |
990.00 |
990.00 - 990.00 |
0.0134 times |
Weekly price and charts SecRed Strong weekly Stock price targets for SecRed 957NIDO26_N5 are 969.5 and 1009 | Weekly Target 1 | 940 | | Weekly Target 2 | 959.5 | | Weekly Target 3 | 979.5 | | Weekly Target 4 | 999 | | Weekly Target 5 | 1019 |
Weekly price and volumes for Sec Red
| Date |
Closing |
Open |
Range |
Volume |
Thu 17 April 2025 |
979.00 (0.86%) |
960.00 |
960.00 - 999.50 |
0.8498 times |
Fri 04 April 2025 |
970.69 (-1.45%) |
950.00 |
950.00 - 1000.00 |
1.9188 times |
Wed 26 March 2025 |
985.00 (-0.51%) |
1000.00 |
960.60 - 1000.00 |
1.2747 times |
Thu 20 March 2025 |
990.00 (0%) |
980.00 |
980.00 - 1001.00 |
1.0555 times |
Thu 13 March 2025 |
990.00 (1.02%) |
980.00 |
980.00 - 990.00 |
0.0731 times |
Fri 07 March 2025 |
980.00 (-0.51%) |
999.50 |
890.00 - 1000.00 |
1.751 times |
Fri 28 February 2025 |
985.00 (-0.51%) |
1015.00 |
985.00 - 1015.00 |
1.2287 times |
Fri 21 February 2025 |
990.00 (0.51%) |
985.00 |
925.20 - 990.00 |
0.4438 times |
Fri 14 February 2025 |
985.00 (1.29%) |
980.10 |
980.10 - 990.00 |
1.3234 times |
Mon 03 February 2025 |
972.47 (0%) |
972.47 |
972.47 - 972.47 |
0.0812 times |
Thu 30 January 2025 |
972.47 (0.67%) |
990.00 |
965.00 - 990.00 |
1.0501 times |

Monthly price and charts SecRed Strong monthly Stock price targets for SecRed 957NIDO26_N5 are 964.5 and 1014.5 | Monthly Target 1 | 926.33 | | Monthly Target 2 | 952.67 | | Monthly Target 3 | 976.33333333333 | | Monthly Target 4 | 1002.67 | | Monthly Target 5 | 1026.33 |
Monthly price and volumes Sec Red
| Date |
Closing |
Open |
Range |
Volume |
Thu 17 April 2025 |
979.00 (-0.61%) |
950.00 |
950.00 - 1000.00 |
0.7515 times |
Wed 26 March 2025 |
985.00 (0%) |
999.50 |
890.00 - 1001.00 |
1.1277 times |
Fri 28 February 2025 |
985.00 (1.29%) |
972.47 |
925.20 - 1015.00 |
0.8353 times |
Thu 30 January 2025 |
972.47 (3.04%) |
943.35 |
942.00 - 1000.00 |
1.0733 times |
Mon 30 December 2024 |
943.76 (-3.7%) |
930.00 |
896.00 - 1001.00 |
1.113 times |
Fri 29 November 2024 |
980.00 (-2%) |
999.00 |
911.11 - 1009.00 |
0.9462 times |
Thu 31 October 2024 |
999.95 (2.14%) |
979.00 |
900.00 - 999.95 |
0.5532 times |
Mon 30 September 2024 |
979.00 (-2.05%) |
1000.00 |
921.00 - 1000.00 |
0.54 times |
Fri 30 August 2024 |
999.50 (4.58%) |
956.01 |
951.01 - 1011.00 |
1.5729 times |
Tue 30 July 2024 |
955.70 (-2.44%) |
970.00 |
940.40 - 989.99 |
1.4869 times |
Fri 28 June 2024 |
979.60 (2.68%) |
945.00 |
936.30 - 984.00 |
1.0087 times |

DMA SMA EMA moving averages of Sec Red 957NIDO26_N5
DMA (daily moving average) of Sec Red 957NIDO26_N5
| DMA period | DMA value | | 5 day DMA | 974.05 | | 12 day DMA | 977.94 | | 20 day DMA | 979.97 | | 35 day DMA | 982.34 | | 50 day DMA | 978.51 | | 100 day DMA | 979.11 | | 150 day DMA | 975.02 | | 200 day DMA | | EMA (exponential moving average) of Sec Red 957NIDO26_N5
| EMA period | EMA current | EMA prev | EMA prev2 | | 5 day EMA | 975.11 | 973.17 | 979.23 | | 12 day EMA | 976.92 | 976.54 | 979.35 | | 20 day EMA | 978.72 | 978.69 | 980.55 | | 35 day EMA | 979.22 | 979.23 | 980.3 | | 50 day EMA | 979.59 | 979.61 | 980.37 |
SMA (simple moving average) of Sec Red 957NIDO26_N5
| SMA period | SMA current | SMA prev | SMA prev2 | | 5 day SMA | 974.05 | 974.37 | 972.16 | | 12 day SMA | 977.94 | 979.61 | 981.19 | | 20 day SMA | 979.97 | 980.27 | 981.61 | | 35 day SMA | 982.34 | 982.11 | 982.25 | | 50 day SMA | 978.51 | 978.93 | 979.71 | | 100 day SMA | 979.11 | 979.17 | 979.26 | | 150 day SMA | 975.02 | 975 | 975.09 | | 200 day SMA |
|
|
