Tsi9 935TSI29_N0 full analysis,charts,indicators,moving averages,SMA,DMA,EMA,ADX,MACD,RSITsi 9 935TSI29_N0 WideScreen charts, DMA,SMA,EMA technical analysis, forecast prediction, by indicators ADX,MACD,RSI,CCI NSE stock exchange
Daily price and charts and targets Tsi9 Strong Daily Stock price targets for Tsi9 935TSI29_N0 are 104307.28 and 104307.28 | Daily Target 1 | 104307.28 | | Daily Target 2 | 104307.28 | | Daily Target 3 | 104307.28 | | Daily Target 4 | 104307.28 | | Daily Target 5 | 104307.28 |
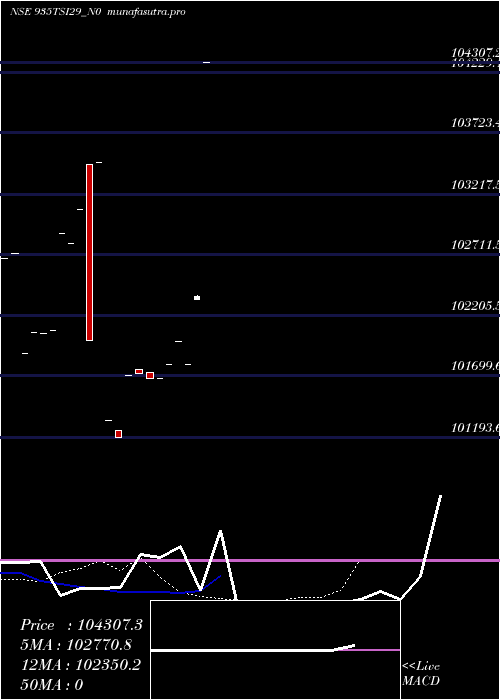
Daily price and volume Tsi 9
| Date |
Closing |
Open |
Range |
Volume |
Tue 28 October 2025 |
104307.28 (1.9%) |
104307.28 |
104307.28 - 104307.28 |
0.3623 times |
Mon 27 October 2025 |
102358.46 (0.55%) |
102343.36 |
102343.36 - 102373.56 |
0.2899 times |
Fri 24 October 2025 |
101800.00 (-0.19%) |
101800.00 |
101800.00 - 101800.00 |
0.2174 times |
Wed 15 October 2025 |
101988.76 (0.19%) |
101988.76 |
101988.76 - 101988.76 |
0.7246 times |
Fri 10 October 2025 |
101800.00 (0.12%) |
101800.00 |
101800.00 - 101800.00 |
0.0725 times |
Tue 07 October 2025 |
101679.32 (0%) |
101679.32 |
101679.32 - 101679.32 |
0.0725 times |
Mon 06 October 2025 |
101679.32 (-0.05%) |
101729.32 |
101679.32 - 101729.32 |
3.6232 times |
Fri 03 October 2025 |
101726.85 (0.02%) |
101756.85 |
101726.85 - 101756.85 |
2.3913 times |
Wed 01 October 2025 |
101703.62 (0.5%) |
101703.62 |
101703.62 - 101703.62 |
1.2319 times |
Thu 25 September 2025 |
101193.63 (-0.14%) |
101254.93 |
101193.63 - 101254.93 |
1.0145 times |
Wed 17 September 2025 |
101331.99 (-2.08%) |
101331.99 |
101331.99 - 101331.99 |
1.4493 times |
Weekly price and charts Tsi9 Strong weekly Stock price targets for Tsi9 935TSI29_N0 are 103325.32 and 105289.24 | Weekly Target 1 | 101688.72 | | Weekly Target 2 | 102998 | | Weekly Target 3 | 103652.64 | | Weekly Target 4 | 104961.92 | | Weekly Target 5 | 105616.56 |
Weekly price and volumes for Tsi 9
| Date |
Closing |
Open |
Range |
Volume |
Tue 28 October 2025 |
104307.28 (2.46%) |
102343.36 |
102343.36 - 104307.28 |
0.2746 times |
Fri 24 October 2025 |
101800.00 (0%) |
101988.76 |
101800.00 - 101988.76 |
0.3966 times |
Fri 10 October 2025 |
101800.00 (0.07%) |
101729.32 |
101679.32 - 101800.00 |
1.5863 times |
Fri 03 October 2025 |
101726.85 (0.53%) |
101703.62 |
101703.62 - 101756.85 |
1.5253 times |
Thu 25 September 2025 |
101193.63 (-2.21%) |
101331.99 |
101193.63 - 101331.99 |
1.0372 times |
Wed 10 September 2025 |
103482.20 (0.66%) |
103085.74 |
102000.38 - 103482.20 |
0.2746 times |
Mon 18 August 2025 |
102800.00 (-0.09%) |
102800.00 |
102800.00 - 102800.00 |
0.0305 times |
Thu 14 August 2025 |
102888.01 (0.98%) |
102064.16 |
102056.88 - 102888.01 |
0.7016 times |
Tue 15 July 2025 |
101884.56 (0%) |
102723.73 |
101884.56 - 102723.73 |
3.1727 times |
Wed 29 October 2025 |
(0%) |
|
- |
0 times |

Monthly price and charts Tsi9 Strong monthly Stock price targets for Tsi9 935TSI29_N0 are 102993.3 and 105621.26 | Monthly Target 1 | 100803.33 | | Monthly Target 2 | 102555.31 | | Monthly Target 3 | 103431.29333333 | | Monthly Target 4 | 105183.27 | | Monthly Target 5 | 106059.25 |
Monthly price and volumes Tsi 9
| Date |
Closing |
Open |
Range |
Volume |
Tue 28 October 2025 |
104307.28 (3.08%) |
101703.62 |
101679.32 - 104307.28 |
1.8836 times |
Thu 25 September 2025 |
101193.63 (-1.84%) |
103457.38 |
101193.63 - 103482.20 |
0.638 times |
Mon 25 August 2025 |
103085.74 (0.98%) |
102888.01 |
102800.00 - 103085.74 |
0.0456 times |
Wed 23 July 2025 |
102081.49 (-0.63%) |
101884.56 |
101884.56 - 102081.49 |
0.395 times |
Mon 06 January 2025 |
102723.73 (0.04%) |
102723.73 |
102723.73 - 102723.73 |
1.5191 times |
Tue 31 December 2024 |
102680.00 (0%) |
102680.00 |
102680.00 - 102680.00 |
1.5191 times |
Wed 29 October 2025 |
(0%) |
|
- |
0 times |

DMA SMA EMA moving averages of Tsi 9 935TSI29_N0
DMA (daily moving average) of Tsi 9 935TSI29_N0
| DMA period | DMA value | | 5 day DMA | 102450.9 | | 12 day DMA | 102087.62 | | 20 day DMA | 102195.63 | | 35 day DMA | | | 50 day DMA | | | 100 day DMA | | | 150 day DMA | | | 200 day DMA | | EMA (exponential moving average) of Tsi 9 935TSI29_N0
| EMA period | EMA current | EMA prev | EMA prev2 | | 5 day EMA | 102770.75 | 102002.6 | 101824.69 | | 12 day EMA | 102350.21 | 101994.51 | 101928.36 | | 20 day EMA | 102359.03 | 102154.04 | 102132.53 | | 35 day EMA | 0 | 0 | 0 | | 50 day EMA | 0 | 0 | 0 |
SMA (simple moving average) of Tsi 9 935TSI29_N0
| SMA period | SMA current | SMA prev | SMA prev2 | | 5 day SMA | 102450.9 | 101925.31 | 101789.48 | | 12 day SMA | 102087.62 | 101895.38 | 101955.98 | | 20 day SMA | 102195.63 | | 35 day SMA | | 50 day SMA | | 100 day SMA | | 150 day SMA | | 200 day SMA |
|
|
