GoiLoan 92GS2030_GS full analysis,charts,indicators,moving averages,SMA,DMA,EMA,ADX,MACD,RSIGoi Loan 92GS2030_GS WideScreen charts, DMA,SMA,EMA technical analysis, forecast prediction, by indicators ADX,MACD,RSI,CCI NSE stock exchange
Daily price and charts and targets GoiLoan Strong Daily Stock price targets for GoiLoan 92GS2030_GS are 114.42 and 114.97 | Daily Target 1 | 114.29 | | Daily Target 2 | 114.54 | | Daily Target 3 | 114.84333333333 | | Daily Target 4 | 115.09 | | Daily Target 5 | 115.39 |
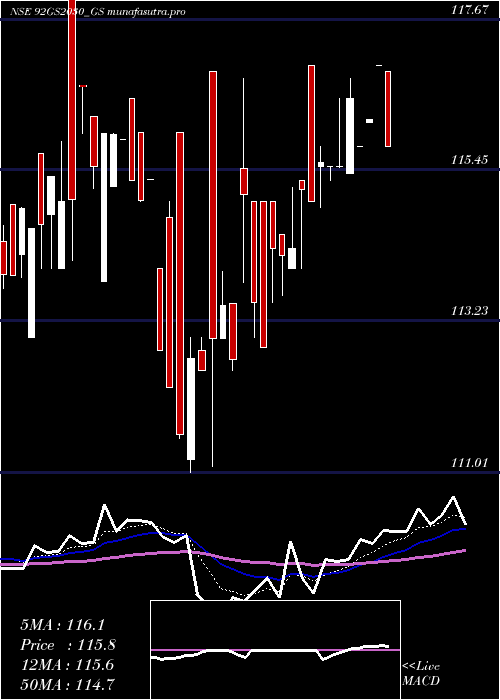
Daily price and volume Goi Loan
| Date |
Closing |
Open |
Range |
Volume |
Tue 28 October 2025 |
114.78 (-0.36%) |
115.15 |
114.60 - 115.15 |
2.5213 times |
Mon 27 October 2025 |
115.20 (0%) |
115.20 |
115.20 - 115.20 |
0.1935 times |
Fri 24 October 2025 |
115.20 (0.08%) |
115.20 |
115.20 - 115.20 |
0.0678 times |
Thu 23 October 2025 |
115.11 (0.1%) |
115.20 |
115.00 - 115.20 |
2.0434 times |
Tue 21 October 2025 |
114.99 (-0.01%) |
115.00 |
114.99 - 115.00 |
0.3119 times |
Mon 20 October 2025 |
115.00 (-0.42%) |
114.70 |
114.70 - 115.00 |
0.7478 times |
Fri 17 October 2025 |
115.48 (0.3%) |
115.50 |
114.70 - 115.50 |
0.2571 times |
Thu 16 October 2025 |
115.13 (0.11%) |
114.50 |
114.50 - 115.50 |
1.9707 times |
Wed 15 October 2025 |
115.00 (-0.22%) |
115.40 |
114.50 - 115.40 |
0.7739 times |
Tue 14 October 2025 |
115.25 (0%) |
115.00 |
115.00 - 115.25 |
1.1126 times |
Mon 13 October 2025 |
115.25 (-0.26%) |
115.35 |
115.25 - 115.53 |
0.6054 times |
Weekly price and charts GoiLoan Strong weekly Stock price targets for GoiLoan 92GS2030_GS are 114.39 and 114.99 | Weekly Target 1 | 114.26 | | Weekly Target 2 | 114.52 | | Weekly Target 3 | 114.86 | | Weekly Target 4 | 115.12 | | Weekly Target 5 | 115.46 |
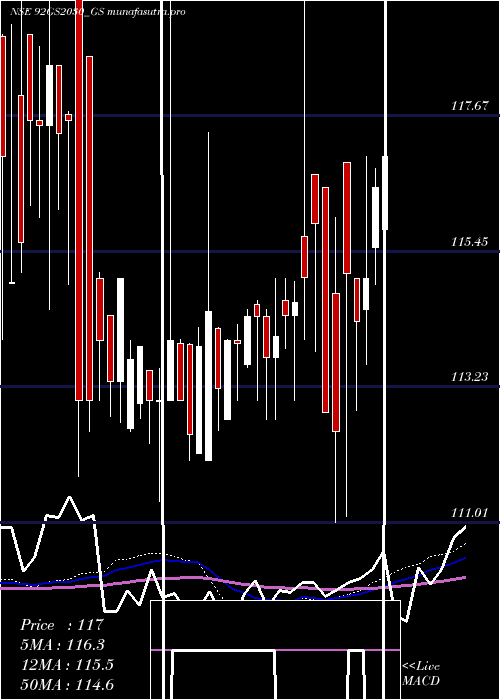
Weekly price and volumes for Goi Loan
| Date |
Closing |
Open |
Range |
Volume |
Tue 28 October 2025 |
114.78 (-0.36%) |
115.20 |
114.60 - 115.20 |
0.7831 times |
Fri 24 October 2025 |
115.20 (-0.24%) |
114.70 |
114.70 - 115.20 |
0.9147 times |
Fri 17 October 2025 |
115.48 (-0.06%) |
115.35 |
114.50 - 115.53 |
1.3615 times |
Fri 10 October 2025 |
115.55 (0.05%) |
115.50 |
114.01 - 115.55 |
0.4024 times |
Fri 03 October 2025 |
115.49 (-2.13%) |
116.00 |
114.00 - 118.00 |
2.0337 times |
Fri 26 September 2025 |
118.00 (-0.56%) |
115.55 |
115.05 - 118.70 |
0.2247 times |
Fri 19 September 2025 |
118.67 (0.65%) |
117.00 |
116.00 - 119.50 |
1.8945 times |
Fri 12 September 2025 |
117.90 (0.77%) |
120.00 |
116.00 - 120.00 |
1.2002 times |
Fri 05 September 2025 |
117.00 (-0.43%) |
117.60 |
115.50 - 118.00 |
0.5375 times |
Fri 29 August 2025 |
117.50 (0.43%) |
117.00 |
116.50 - 123.00 |
0.6476 times |
Fri 22 August 2025 |
117.00 (0.3%) |
116.42 |
116.42 - 117.10 |
0.9987 times |
Monthly price and charts GoiLoan Strong monthly Stock price targets for GoiLoan 92GS2030_GS are 113.24 and 115.54 | Monthly Target 1 | 112.73 | | Monthly Target 2 | 113.75 | | Monthly Target 3 | 115.02666666667 | | Monthly Target 4 | 116.05 | | Monthly Target 5 | 117.33 |
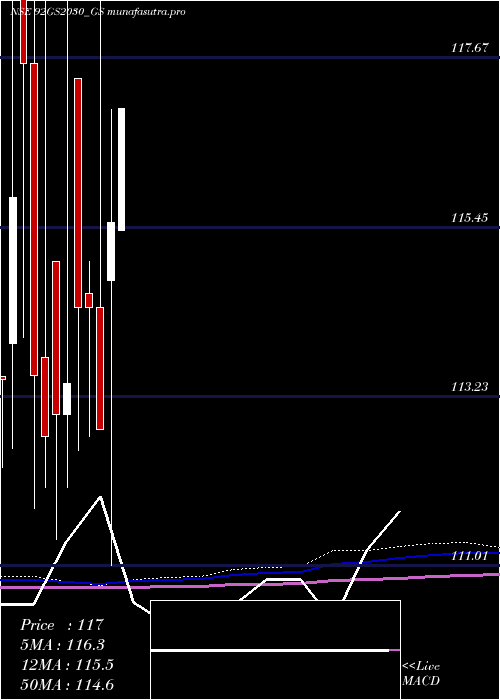
Monthly price and volumes Goi Loan
| Date |
Closing |
Open |
Range |
Volume |
Tue 28 October 2025 |
114.78 (-0.45%) |
115.00 |
114.00 - 116.30 |
1.2441 times |
Tue 30 September 2025 |
115.30 (-1.87%) |
117.60 |
115.05 - 120.00 |
0.9272 times |
Fri 29 August 2025 |
117.50 (0.99%) |
116.60 |
116.00 - 123.00 |
0.6639 times |
Thu 31 July 2025 |
116.35 (-1.06%) |
117.20 |
115.40 - 119.99 |
1.0244 times |
Mon 30 June 2025 |
117.60 (0.64%) |
117.40 |
113.10 - 123.00 |
0.696 times |
Fri 30 May 2025 |
116.85 (1.16%) |
115.40 |
115.00 - 117.75 |
1.2663 times |
Wed 30 April 2025 |
115.51 (2.4%) |
114.75 |
111.01 - 116.99 |
1.6284 times |
Fri 28 March 2025 |
112.80 (-1.4%) |
114.40 |
112.80 - 120.65 |
1.1781 times |
Fri 28 February 2025 |
114.40 (0.01%) |
114.58 |
112.70 - 115.00 |
0.4286 times |
Fri 31 January 2025 |
114.39 (0.87%) |
117.40 |
112.51 - 117.40 |
0.9429 times |
Tue 31 December 2024 |
113.40 (0.35%) |
113.00 |
112.03 - 119.61 |
0.9073 times |
DMA SMA EMA moving averages of Goi Loan 92GS2030_GS
DMA (daily moving average) of Goi Loan 92GS2030_GS
| DMA period | DMA value | | 5 day DMA | 115.06 | | 12 day DMA | 115.16 | | 20 day DMA | 115.36 | | 35 day DMA | 116.56 | | 50 day DMA | 116.64 | | 100 day DMA | 116.62 | | 150 day DMA | 116 | | 200 day DMA | 115.49 | EMA (exponential moving average) of Goi Loan 92GS2030_GS
| EMA period | EMA current | EMA prev | EMA prev2 | | 5 day EMA | 115.04 | 115.17 | 115.15 | | 12 day EMA | 115.24 | 115.32 | 115.34 | | 20 day EMA | 115.55 | 115.63 | 115.68 | | 35 day EMA | 115.9 | 115.97 | 116.02 | | 50 day EMA | 116.46 | 116.53 | 116.58 |
SMA (simple moving average) of Goi Loan 92GS2030_GS
| SMA period | SMA current | SMA prev | SMA prev2 | | 5 day SMA | 115.06 | 115.1 | 115.16 | | 12 day SMA | 115.16 | 115.19 | 115.21 | | 20 day SMA | 115.36 | 115.53 | 115.67 | | 35 day SMA | 116.56 | 116.62 | 116.68 | | 50 day SMA | 116.64 | 116.67 | 116.69 | | 100 day SMA | 116.62 | 116.62 | 116.63 | | 150 day SMA | 116 | 116 | 115.99 | | 200 day SMA | 115.49 | 115.48 | 115.48 |
|
|
