GoiTbill 91D301025_TB full analysis,charts,indicators,moving averages,SMA,DMA,EMA,ADX,MACD,RSIGoi Tbill 91D301025_TB WideScreen charts, DMA,SMA,EMA technical analysis, forecast prediction, by indicators ADX,MACD,RSI,CCI NSE stock exchange
Daily price and charts and targets GoiTbill Strong Daily Stock price targets for GoiTbill 91D301025_TB are 99.53 and 99.53 | Daily Target 1 | 99.53 | | Daily Target 2 | 99.53 | | Daily Target 3 | 99.53 | | Daily Target 4 | 99.53 | | Daily Target 5 | 99.53 |
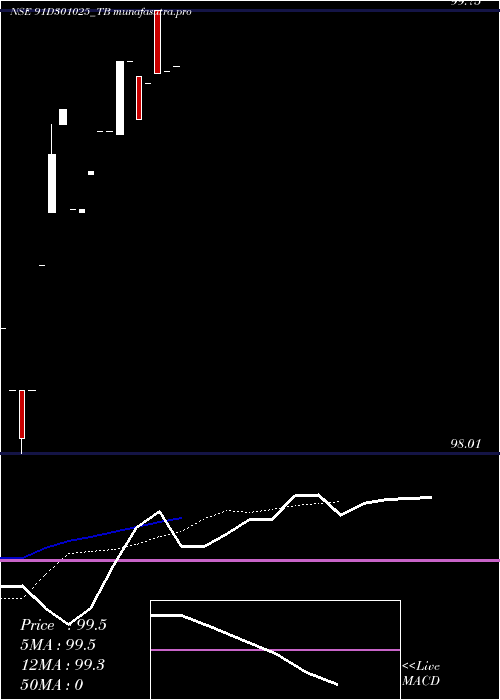
Daily price and volume Goi Tbill
| Date |
Closing |
Open |
Range |
Volume |
Mon 27 October 2025 |
99.53 (0.02%) |
99.53 |
99.53 - 99.53 |
0.0758 times |
Fri 24 October 2025 |
99.51 (0.01%) |
99.51 |
99.51 - 99.51 |
0.0758 times |
Fri 17 October 2025 |
99.50 (0.04%) |
99.75 |
99.50 - 99.75 |
1.5152 times |
Wed 15 October 2025 |
99.46 (0.14%) |
99.46 |
99.46 - 99.46 |
0.0758 times |
Wed 08 October 2025 |
99.32 (-0.23%) |
99.49 |
99.32 - 99.49 |
0.1515 times |
Tue 07 October 2025 |
99.55 (0%) |
99.55 |
99.55 - 99.55 |
0.0758 times |
Wed 01 October 2025 |
99.55 (0.28%) |
99.26 |
99.26 - 99.55 |
7.7273 times |
Tue 30 September 2025 |
99.27 (0%) |
99.27 |
99.27 - 99.27 |
0.0758 times |
Mon 29 September 2025 |
99.27 (0.15%) |
99.27 |
99.27 - 99.27 |
0.0758 times |
Wed 24 September 2025 |
99.12 (0.15%) |
99.11 |
99.11 - 99.12 |
0.1515 times |
Fri 19 September 2025 |
98.97 (0%) |
98.96 |
98.96 - 98.97 |
0.1515 times |
Weekly price and charts GoiTbill Strong weekly Stock price targets for GoiTbill 91D301025_TB are 99.53 and 99.53 | Weekly Target 1 | 99.53 | | Weekly Target 2 | 99.53 | | Weekly Target 3 | 99.53 | | Weekly Target 4 | 99.53 | | Weekly Target 5 | 99.53 |
Weekly price and volumes for Goi Tbill
| Date |
Closing |
Open |
Range |
Volume |
Mon 27 October 2025 |
99.53 (0.02%) |
99.53 |
99.53 - 99.53 |
0.0302 times |
Fri 24 October 2025 |
99.51 (0.01%) |
99.51 |
99.51 - 99.51 |
0.0302 times |
Fri 17 October 2025 |
99.50 (0.18%) |
99.46 |
99.46 - 99.75 |
0.6342 times |
Wed 08 October 2025 |
99.32 (-0.23%) |
99.55 |
99.32 - 99.55 |
0.0906 times |
Wed 01 October 2025 |
99.55 (0.43%) |
99.27 |
99.26 - 99.55 |
3.1409 times |
Wed 24 September 2025 |
99.12 (0.15%) |
99.11 |
99.11 - 99.12 |
0.0604 times |
Fri 19 September 2025 |
98.97 (0.22%) |
98.96 |
98.96 - 99.36 |
3.6544 times |
Mon 18 August 2025 |
98.75 (0.5%) |
98.75 |
98.75 - 98.75 |
0.0906 times |
Thu 07 August 2025 |
98.26 (0%) |
98.50 |
98.01 - 98.50 |
1.2685 times |
Wed 29 October 2025 |
(0%) |
|
- |
0 times |

Monthly price and charts GoiTbill Strong monthly Stock price targets for GoiTbill 91D301025_TB are 99.4 and 99.89 | Monthly Target 1 | 99.02 | | Monthly Target 2 | 99.28 | | Monthly Target 3 | 99.513333333333 | | Monthly Target 4 | 99.77 | | Monthly Target 5 | 100 |
Monthly price and volumes Goi Tbill
| Date |
Closing |
Open |
Range |
Volume |
Mon 27 October 2025 |
99.53 (0.26%) |
99.26 |
99.26 - 99.75 |
1.2886 times |
Tue 30 September 2025 |
99.27 (0.53%) |
98.96 |
98.96 - 99.36 |
1.2584 times |
Mon 18 August 2025 |
98.75 (0%) |
98.50 |
98.01 - 98.75 |
0.453 times |
Wed 29 October 2025 |
(0%) |
|
- |
0 times |

DMA SMA EMA moving averages of Goi Tbill 91D301025_TB
DMA (daily moving average) of Goi Tbill 91D301025_TB
| DMA period | DMA value | | 5 day DMA | 99.46 | | 12 day DMA | 99.34 | | 20 day DMA | | | 35 day DMA | | | 50 day DMA | | | 100 day DMA | | | 150 day DMA | | | 200 day DMA | | EMA (exponential moving average) of Goi Tbill 91D301025_TB
| EMA period | EMA current | EMA prev | EMA prev2 | | 5 day EMA | 99.48 | 99.46 | 99.43 | | 12 day EMA | 99.28 | 99.24 | 99.19 | | 20 day EMA | 0 | 0 | 0 | | 35 day EMA | 0 | 0 | 0 | | 50 day EMA | 0 | 0 | 0 |
SMA (simple moving average) of Goi Tbill 91D301025_TB
| SMA period | SMA current | SMA prev | SMA prev2 | | 5 day SMA | 99.46 | 99.47 | 99.48 | | 12 day SMA | 99.34 | 99.32 | 99.29 | | 20 day SMA | | 35 day SMA | | 50 day SMA | | 100 day SMA | | 150 day SMA | | 200 day SMA |
|
|
