GoiTbill 91D300525_TB full analysis,charts,indicators,moving averages,SMA,DMA,EMA,ADX,MACD,RSIGoi Tbill 91D300525_TB WideScreen charts, DMA,SMA,EMA technical analysis, forecast prediction, by indicators ADX,MACD,RSI,CCI NSE stock exchange
Daily price and charts and targets GoiTbill Strong Daily Stock price targets for GoiTbill 91D300525_TB are 99.5 and 99.5 | Daily Target 1 | 99.5 | | Daily Target 2 | 99.5 | | Daily Target 3 | 99.5 | | Daily Target 4 | 99.5 | | Daily Target 5 | 99.5 |
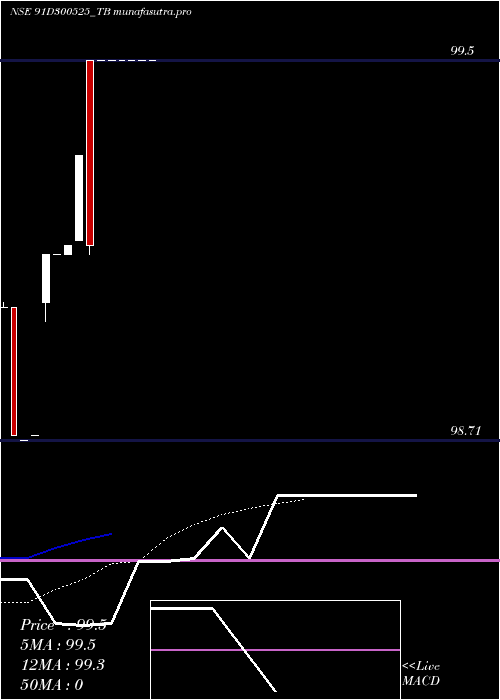
Daily price and volume Goi Tbill
| Date |
Closing |
Open |
Range |
Volume |
| Tue 06 May 2025 |
99.50 (0%) |
99.50 |
99.50 - 99.50 |
0.3008 times |
| Mon 05 May 2025 |
99.50 (0%) |
99.50 |
99.50 - 99.50 |
0.7519 times |
| Fri 02 May 2025 |
99.50 (0%) |
99.50 |
99.50 - 99.50 |
0.0752 times |
| Wed 30 April 2025 |
99.50 (0%) |
99.50 |
99.50 - 99.50 |
0.2256 times |
| Tue 29 April 2025 |
99.50 (0%) |
99.50 |
99.50 - 99.50 |
1.5038 times |
| Mon 28 April 2025 |
99.50 (0.39%) |
99.50 |
99.50 - 99.50 |
0.8271 times |
| Fri 25 April 2025 |
99.11 (-0.19%) |
99.50 |
99.10 - 99.50 |
0.9023 times |
| Tue 22 April 2025 |
99.30 (0.19%) |
99.12 |
99.12 - 99.30 |
3.985 times |
| Mon 21 April 2025 |
99.11 (0.01%) |
99.10 |
99.10 - 99.11 |
0.6015 times |
| Thu 17 April 2025 |
99.10 (0%) |
99.10 |
99.10 - 99.10 |
0.8271 times |
| Tue 15 April 2025 |
99.10 (0.38%) |
99.00 |
98.96 - 99.10 |
1.0526 times |
Weekly price and charts GoiTbill Strong weekly Stock price targets for GoiTbill 91D300525_TB are 99.5 and 99.5 | Weekly Target 1 | 99.5 | | Weekly Target 2 | 99.5 | | Weekly Target 3 | 99.5 | | Weekly Target 4 | 99.5 | | Weekly Target 5 | 99.5 |
Weekly price and volumes for Goi Tbill
| Date |
Closing |
Open |
Range |
Volume |
| Tue 06 May 2025 |
99.50 (0%) |
99.50 |
99.50 - 99.50 |
0.1918 times |
| Fri 02 May 2025 |
99.50 (0.39%) |
99.50 |
99.50 - 99.50 |
0.4795 times |
| Fri 25 April 2025 |
99.11 (0.01%) |
99.10 |
99.10 - 99.50 |
1 times |
| Thu 17 April 2025 |
99.10 (0.38%) |
99.00 |
98.96 - 99.10 |
0.3425 times |
| Fri 11 April 2025 |
98.72 (0%) |
98.99 |
98.71 - 99.00 |
2.9863 times |
| Fri 09 May 2025 |
(0%) |
|
- |
0 times |

Monthly price and charts GoiTbill Strong monthly Stock price targets for GoiTbill 91D300525_TB are 99.5 and 99.5 | Monthly Target 1 | 99.5 | | Monthly Target 2 | 99.5 | | Monthly Target 3 | 99.5 | | Monthly Target 4 | 99.5 | | Monthly Target 5 | 99.5 |
Monthly price and volumes Goi Tbill
| Date |
Closing |
Open |
Range |
Volume |
| Tue 06 May 2025 |
99.50 (0%) |
99.50 |
99.50 - 99.50 |
0.0822 times |
| Wed 30 April 2025 |
99.50 (0%) |
98.99 |
98.71 - 99.50 |
1.9178 times |
| Fri 09 May 2025 |
(0%) |
|
- |
0 times |

DMA SMA EMA moving averages of Goi Tbill 91D300525_TB
DMA (daily moving average) of Goi Tbill 91D300525_TB
| DMA period | DMA value | | 5 day DMA | 99.5 | | 12 day DMA | 99.29 | | 20 day DMA | | | 35 day DMA | | | 50 day DMA | | | 100 day DMA | | | 150 day DMA | | | 200 day DMA | | EMA (exponential moving average) of Goi Tbill 91D300525_TB
| EMA period | EMA current | EMA prev | EMA prev2 | | 5 day EMA | 99.47 | 99.45 | 99.42 | | 12 day EMA | 99.26 | 99.22 | 99.17 | | 20 day EMA | 0 | 0 | 0 | | 35 day EMA | 0 | 0 | 0 | | 50 day EMA | 0 | 0 | 0 |
SMA (simple moving average) of Goi Tbill 91D300525_TB
| SMA period | SMA current | SMA prev | SMA prev2 | | 5 day SMA | 99.5 | 99.5 | 99.42 | | 12 day SMA | 99.29 | 99.22 | | 20 day SMA | | 35 day SMA | | 50 day SMA | | 100 day SMA | | 150 day SMA | | 200 day SMA |
|
|
