GoiTbill 91D201125_TB full analysis,charts,indicators,moving averages,SMA,DMA,EMA,ADX,MACD,RSIGoi Tbill 91D201125_TB WideScreen charts, DMA,SMA,EMA technical analysis, forecast prediction, by indicators ADX,MACD,RSI,CCI NSE stock exchange
Daily price and charts and targets GoiTbill Strong Daily Stock price targets for GoiTbill 91D201125_TB are 99.45 and 99.45 | Daily Target 1 | 99.45 | | Daily Target 2 | 99.45 | | Daily Target 3 | 99.45 | | Daily Target 4 | 99.45 | | Daily Target 5 | 99.45 |
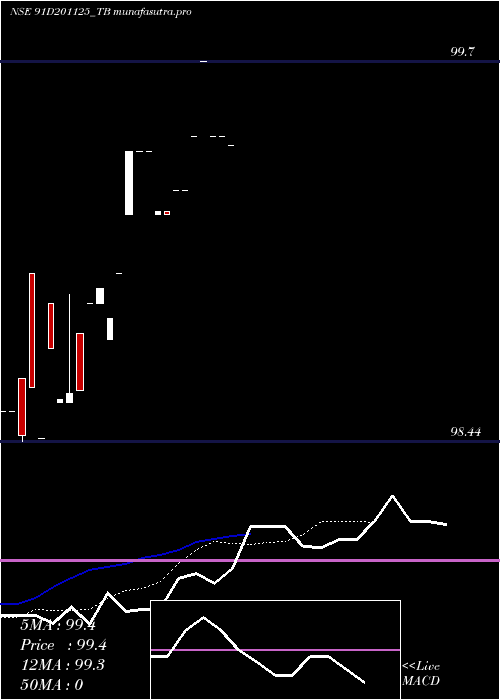
Daily price and volume Goi Tbill
| Date |
Closing |
Open |
Range |
Volume |
Tue 28 October 2025 |
99.45 (0%) |
99.45 |
99.45 - 99.45 |
0.6897 times |
Mon 27 October 2025 |
99.45 (-0.25%) |
99.45 |
99.45 - 99.45 |
0.6897 times |
Fri 24 October 2025 |
99.70 (0.25%) |
99.70 |
99.70 - 99.70 |
3.1034 times |
Thu 23 October 2025 |
99.45 (0.18%) |
99.45 |
99.45 - 99.45 |
0.6897 times |
Tue 21 October 2025 |
99.27 (0%) |
99.27 |
99.27 - 99.27 |
0.3448 times |
Mon 20 October 2025 |
99.27 (0.08%) |
99.27 |
99.27 - 99.27 |
0.3448 times |
Fri 17 October 2025 |
99.19 (-0.01%) |
99.20 |
99.19 - 99.20 |
1.0345 times |
Thu 16 October 2025 |
99.20 (-0.2%) |
99.19 |
99.19 - 99.20 |
0.6897 times |
Wed 15 October 2025 |
99.40 (0%) |
99.40 |
99.40 - 99.40 |
2.069 times |
Tue 14 October 2025 |
99.40 (0%) |
99.40 |
99.40 - 99.40 |
0.3448 times |
Mon 13 October 2025 |
99.40 (0.4%) |
99.19 |
99.19 - 99.40 |
32.7586 times |
Weekly price and charts GoiTbill Strong weekly Stock price targets for GoiTbill 91D201125_TB are 99.45 and 99.45 | Weekly Target 1 | 99.45 | | Weekly Target 2 | 99.45 | | Weekly Target 3 | 99.45 | | Weekly Target 4 | 99.45 | | Weekly Target 5 | 99.45 |
Weekly price and volumes for Goi Tbill
| Date |
Closing |
Open |
Range |
Volume |
Tue 28 October 2025 |
99.45 (-0.25%) |
99.45 |
99.45 - 99.45 |
0.0821 times |
Fri 24 October 2025 |
99.70 (0.51%) |
99.27 |
99.27 - 99.70 |
0.2669 times |
Fri 17 October 2025 |
99.19 (0.19%) |
99.19 |
99.19 - 99.40 |
2.1965 times |
Wed 24 September 2025 |
99.00 (0.05%) |
98.78 |
98.78 - 99.00 |
0.0616 times |
Wed 17 September 2025 |
98.95 (0.34%) |
98.90 |
98.90 - 98.95 |
1.6833 times |
Thu 11 September 2025 |
98.61 (0.16%) |
98.90 |
98.57 - 98.93 |
1.5396 times |
Thu 04 September 2025 |
98.45 (0%) |
98.54 |
98.44 - 99.00 |
1.1701 times |
Tue 28 October 2025 |
(0%) |
|
- |
0 times |

Monthly price and charts GoiTbill Strong monthly Stock price targets for GoiTbill 91D201125_TB are 99.32 and 99.83 | Monthly Target 1 | 98.94 | | Monthly Target 2 | 99.19 | | Monthly Target 3 | 99.446666666667 | | Monthly Target 4 | 99.7 | | Monthly Target 5 | 99.96 |
Monthly price and volumes Goi Tbill
| Date |
Closing |
Open |
Range |
Volume |
Tue 28 October 2025 |
99.45 (0.45%) |
99.19 |
99.19 - 99.70 |
1.0814 times |
Wed 24 September 2025 |
99.00 (0.47%) |
98.54 |
98.44 - 99.00 |
1.8924 times |
Fri 29 August 2025 |
98.54 (0%) |
98.54 |
98.54 - 98.54 |
0.0262 times |
Tue 28 October 2025 |
(0%) |
|
- |
0 times |

DMA SMA EMA moving averages of Goi Tbill 91D201125_TB
DMA (daily moving average) of Goi Tbill 91D201125_TB
| DMA period | DMA value | | 5 day DMA | 99.46 | | 12 day DMA | 99.35 | | 20 day DMA | 99.09 | | 35 day DMA | | | 50 day DMA | | | 100 day DMA | | | 150 day DMA | | | 200 day DMA | | EMA (exponential moving average) of Goi Tbill 91D201125_TB
| EMA period | EMA current | EMA prev | EMA prev2 | | 5 day EMA | 99.45 | 99.45 | 99.45 | | 12 day EMA | 99.3 | 99.27 | 99.24 | | 20 day EMA | 99.1 | 99.06 | 99.02 | | 35 day EMA | 0 | 0 | 0 | | 50 day EMA | 0 | 0 | 0 |
SMA (simple moving average) of Goi Tbill 91D201125_TB
| SMA period | SMA current | SMA prev | SMA prev2 | | 5 day SMA | 99.46 | 99.43 | 99.38 | | 12 day SMA | 99.35 | 99.3 | 99.26 | | 20 day SMA | 99.09 | 99.05 | 99 | | 35 day SMA | | 50 day SMA | | 100 day SMA | | 150 day SMA | | 200 day SMA |
|
|
