GoiTbill 91D190625_TB full analysis,charts,indicators,moving averages,SMA,DMA,EMA,ADX,MACD,RSIGoi Tbill 91D190625_TB WideScreen charts, DMA,SMA,EMA technical analysis, forecast prediction, by indicators ADX,MACD,RSI,CCI NSE stock exchange
Daily price and charts and targets GoiTbill Strong Daily Stock price targets for GoiTbill 91D190625_TB are 99.01 and 99.01 | Daily Target 1 | 99.01 | | Daily Target 2 | 99.01 | | Daily Target 3 | 99.01 | | Daily Target 4 | 99.01 | | Daily Target 5 | 99.01 |
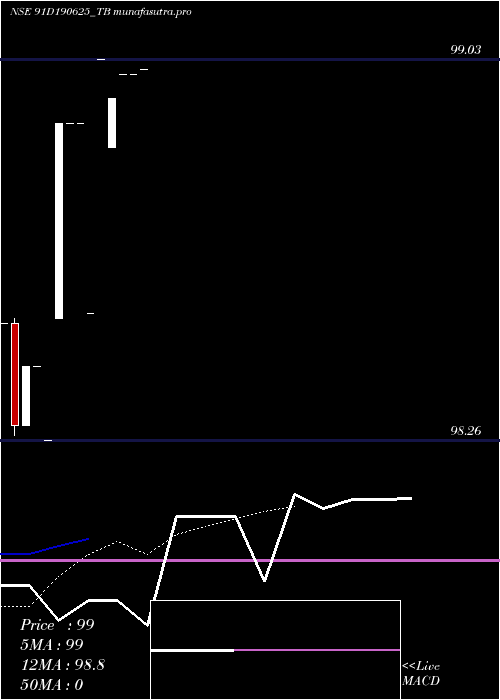
Daily price and volume Goi Tbill
| Date |
Closing |
Open |
Range |
Volume |
| Mon 05 May 2025 |
99.01 (0.01%) |
99.01 |
99.01 - 99.01 |
0.1099 times |
| Fri 02 May 2025 |
99.00 (0%) |
99.00 |
99.00 - 99.00 |
0.1099 times |
| Wed 30 April 2025 |
99.00 (0.05%) |
99.00 |
99.00 - 99.00 |
0.1099 times |
| Tue 29 April 2025 |
98.95 (-0.08%) |
98.85 |
98.85 - 98.95 |
0.4396 times |
| Mon 21 April 2025 |
99.03 (0.52%) |
99.03 |
99.03 - 99.03 |
2.1978 times |
| Thu 17 April 2025 |
98.52 (-0.38%) |
98.52 |
98.52 - 98.52 |
0.1099 times |
| Wed 16 April 2025 |
98.90 (0%) |
98.90 |
98.90 - 98.90 |
0.1099 times |
| Tue 15 April 2025 |
98.90 (0%) |
98.90 |
98.90 - 98.90 |
1.2088 times |
| Fri 11 April 2025 |
98.90 (0.65%) |
98.51 |
98.51 - 98.90 |
3.4066 times |
| Wed 09 April 2025 |
98.26 (-0.15%) |
98.26 |
98.26 - 98.26 |
2.1978 times |
| Tue 08 April 2025 |
98.41 (0%) |
98.41 |
98.41 - 98.41 |
0.5495 times |
Weekly price and charts GoiTbill Strong weekly Stock price targets for GoiTbill 91D190625_TB are 99.01 and 99.01 | Weekly Target 1 | 99.01 | | Weekly Target 2 | 99.01 | | Weekly Target 3 | 99.01 | | Weekly Target 4 | 99.01 | | Weekly Target 5 | 99.01 |
Weekly price and volumes for Goi Tbill
| Date |
Closing |
Open |
Range |
Volume |
| Mon 05 May 2025 |
99.01 (0.01%) |
99.01 |
99.01 - 99.01 |
0.0252 times |
| Fri 02 May 2025 |
99.00 (0.49%) |
99.03 |
98.85 - 99.03 |
0.6541 times |
| Thu 17 April 2025 |
98.52 (-0.38%) |
98.90 |
98.52 - 98.90 |
0.327 times |
| Fri 11 April 2025 |
98.90 (0%) |
98.29 |
98.26 - 98.90 |
2.9937 times |
| Thu 08 May 2025 |
(0%) |
|
- |
0 times |

Monthly price and charts GoiTbill Strong monthly Stock price targets for GoiTbill 91D190625_TB are 99.01 and 99.02 | Monthly Target 1 | 99 | | Monthly Target 2 | 99 | | Monthly Target 3 | 99.006666666667 | | Monthly Target 4 | 99.01 | | Monthly Target 5 | 99.02 |
Monthly price and volumes Goi Tbill
| Date |
Closing |
Open |
Range |
Volume |
| Mon 05 May 2025 |
99.01 (0.01%) |
99.00 |
99.00 - 99.01 |
0.0238 times |
| Wed 30 April 2025 |
99.00 (0%) |
98.50 |
98.26 - 99.03 |
1.9762 times |
| Thu 08 May 2025 |
(0%) |
|
- |
0 times |

DMA SMA EMA moving averages of Goi Tbill 91D190625_TB
DMA (daily moving average) of Goi Tbill 91D190625_TB
| DMA period | DMA value | | 5 day DMA | 99 | | 12 day DMA | 98.77 | | 20 day DMA | | | 35 day DMA | | | 50 day DMA | | | 100 day DMA | | | 150 day DMA | | | 200 day DMA | | EMA (exponential moving average) of Goi Tbill 91D190625_TB
| EMA period | EMA current | EMA prev | EMA prev2 | | 5 day EMA | 98.96 | 98.93 | 98.89 | | 12 day EMA | 98.76 | 98.72 | 98.67 | | 20 day EMA | 0 | 0 | 0 | | 35 day EMA | 0 | 0 | 0 | | 50 day EMA | 0 | 0 | 0 |
SMA (simple moving average) of Goi Tbill 91D190625_TB
| SMA period | SMA current | SMA prev | SMA prev2 | | 5 day SMA | 99 | 98.9 | 98.88 | | 12 day SMA | 98.77 | | 20 day SMA | | 35 day SMA | | 50 day SMA | | 100 day SMA | | 150 day SMA | | 200 day SMA |
|
|
