GoiTbill 91D181225_TB full analysis,charts,indicators,moving averages,SMA,DMA,EMA,ADX,MACD,RSIGoi Tbill 91D181225_TB WideScreen charts, DMA,SMA,EMA technical analysis, forecast prediction, by indicators ADX,MACD,RSI,CCI NSE stock exchange
Daily price and charts and targets GoiTbill Strong Daily Stock price targets for GoiTbill 91D181225_TB are 99.21 and 99.21 | Daily Target 1 | 99.21 | | Daily Target 2 | 99.21 | | Daily Target 3 | 99.21 | | Daily Target 4 | 99.21 | | Daily Target 5 | 99.21 |
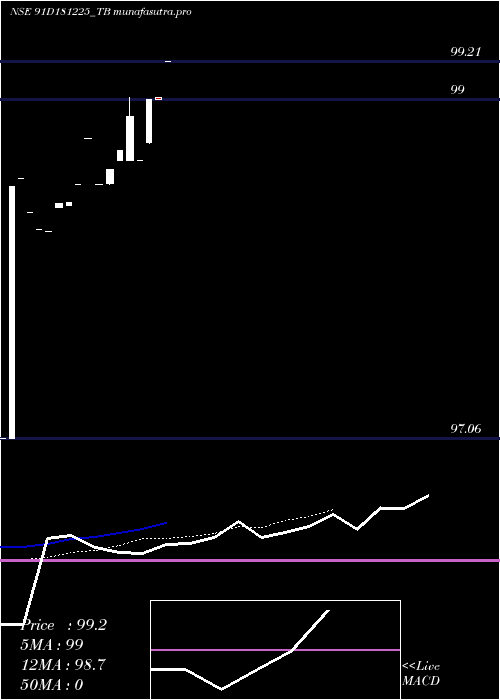
Daily price and volume Goi Tbill
| Date |
Closing |
Open |
Range |
Volume |
Fri 24 October 2025 |
99.21 (0.21%) |
99.21 |
99.21 - 99.21 |
0.4854 times |
Thu 23 October 2025 |
99.00 (0%) |
99.01 |
99.00 - 99.01 |
0.1942 times |
Mon 20 October 2025 |
99.00 (0.35%) |
98.75 |
98.74 - 99.00 |
0.3398 times |
Wed 15 October 2025 |
98.65 (-0.25%) |
98.65 |
98.65 - 98.65 |
0.1456 times |
Tue 14 October 2025 |
98.90 (0.2%) |
98.65 |
98.65 - 99.01 |
1.8447 times |
Mon 13 October 2025 |
98.70 (0.1%) |
98.65 |
98.65 - 98.70 |
0.1942 times |
Fri 10 October 2025 |
98.60 (0.09%) |
98.52 |
98.51 - 98.60 |
3.5437 times |
Thu 09 October 2025 |
98.51 (-0.26%) |
98.51 |
98.51 - 98.51 |
0.9709 times |
Wed 08 October 2025 |
98.77 (0.26%) |
98.77 |
98.77 - 98.77 |
2.1845 times |
Mon 06 October 2025 |
98.51 (0.1%) |
98.51 |
98.51 - 98.51 |
0.0971 times |
Wed 01 October 2025 |
98.41 (0.01%) |
98.39 |
98.39 - 98.41 |
0.1456 times |
Weekly price and charts GoiTbill Strong weekly Stock price targets for GoiTbill 91D181225_TB are 98.98 and 99.45 | Weekly Target 1 | 98.58 | | Weekly Target 2 | 98.9 | | Weekly Target 3 | 99.053333333333 | | Weekly Target 4 | 99.37 | | Weekly Target 5 | 99.52 |
Weekly price and volumes for Goi Tbill
| Date |
Closing |
Open |
Range |
Volume |
Fri 24 October 2025 |
99.21 (0.57%) |
98.75 |
98.74 - 99.21 |
0.3804 times |
Wed 15 October 2025 |
98.65 (0.05%) |
98.65 |
98.65 - 99.01 |
0.8152 times |
Fri 10 October 2025 |
98.60 (0.19%) |
98.51 |
98.51 - 98.77 |
2.5362 times |
Wed 01 October 2025 |
98.41 (0.17%) |
98.38 |
98.38 - 98.41 |
0.8514 times |
Fri 26 September 2025 |
98.24 (0%) |
97.06 |
97.06 - 98.55 |
0.4167 times |
Tue 28 October 2025 |
(0%) |
|
- |
0 times |

Monthly price and charts GoiTbill Strong monthly Stock price targets for GoiTbill 91D181225_TB are 98.8 and 99.62 | Monthly Target 1 | 98.12 | | Monthly Target 2 | 98.66 | | Monthly Target 3 | 98.936666666667 | | Monthly Target 4 | 99.48 | | Monthly Target 5 | 99.76 |
Monthly price and volumes Goi Tbill
| Date |
Closing |
Open |
Range |
Volume |
Fri 24 October 2025 |
99.21 (0.82%) |
98.39 |
98.39 - 99.21 |
1.509 times |
Mon 29 September 2025 |
98.40 (0%) |
97.06 |
97.06 - 98.55 |
0.491 times |
Tue 28 October 2025 |
(0%) |
|
- |
0 times |

DMA SMA EMA moving averages of Goi Tbill 91D181225_TB
DMA (daily moving average) of Goi Tbill 91D181225_TB
| DMA period | DMA value | | 5 day DMA | 98.95 | | 12 day DMA | 98.72 | | 20 day DMA | | | 35 day DMA | | | 50 day DMA | | | 100 day DMA | | | 150 day DMA | | | 200 day DMA | | EMA (exponential moving average) of Goi Tbill 91D181225_TB
| EMA period | EMA current | EMA prev | EMA prev2 | | 5 day EMA | 98.98 | 98.86 | 98.79 | | 12 day EMA | 98.74 | 98.65 | 98.59 | | 20 day EMA | 0 | 0 | 0 | | 35 day EMA | 0 | 0 | 0 | | 50 day EMA | 0 | 0 | 0 |
SMA (simple moving average) of Goi Tbill 91D181225_TB
| SMA period | SMA current | SMA prev | SMA prev2 | | 5 day SMA | 98.95 | 98.85 | 98.77 | | 12 day SMA | 98.72 | 98.64 | 98.58 | | 20 day SMA | | 35 day SMA | | 50 day SMA | | 100 day SMA | | 150 day SMA | | 200 day SMA |
|
|
