GoiTbill 91D131125_TB full analysis,charts,indicators,moving averages,SMA,DMA,EMA,ADX,MACD,RSIGoi Tbill 91D131125_TB WideScreen charts, DMA,SMA,EMA technical analysis, forecast prediction, by indicators ADX,MACD,RSI,CCI NSE stock exchange
Daily price and charts and targets GoiTbill Strong Daily Stock price targets for GoiTbill 91D131125_TB are 99.7 and 99.7 | Daily Target 1 | 99.7 | | Daily Target 2 | 99.7 | | Daily Target 3 | 99.7 | | Daily Target 4 | 99.7 | | Daily Target 5 | 99.7 |
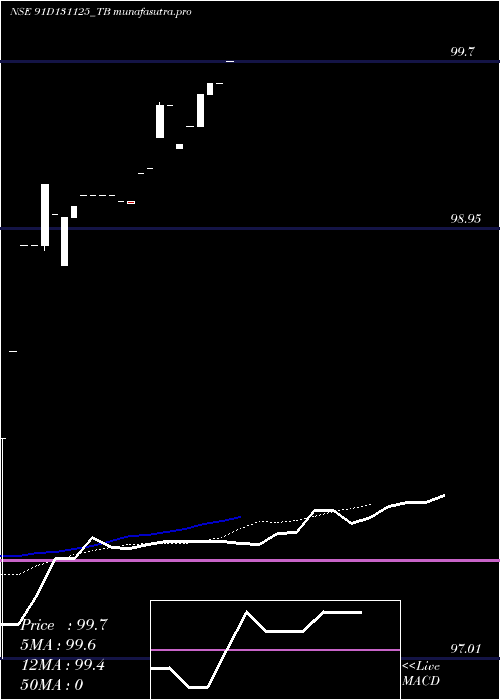
Daily price and volume Goi Tbill
| Date |
Closing |
Open |
Range |
Volume |
Tue 28 October 2025 |
99.70 (0.1%) |
99.70 |
99.70 - 99.70 |
2.1429 times |
Fri 24 October 2025 |
99.60 (0%) |
99.60 |
99.60 - 99.60 |
0.8929 times |
Thu 23 October 2025 |
99.60 (0.05%) |
99.55 |
99.55 - 99.60 |
0.3571 times |
Mon 20 October 2025 |
99.55 (0.15%) |
99.40 |
99.40 - 99.55 |
0.3571 times |
Fri 17 October 2025 |
99.40 (0.08%) |
99.40 |
99.40 - 99.40 |
1.9643 times |
Wed 15 October 2025 |
99.32 (-0.18%) |
99.30 |
99.30 - 99.32 |
0.7143 times |
Tue 14 October 2025 |
99.50 (0%) |
99.50 |
99.50 - 99.50 |
0.3571 times |
Mon 13 October 2025 |
99.50 (0.28%) |
99.35 |
99.35 - 99.51 |
2.8571 times |
Tue 07 October 2025 |
99.22 (0.02%) |
99.22 |
99.22 - 99.22 |
0.1786 times |
Mon 06 October 2025 |
99.20 (0.14%) |
99.20 |
99.20 - 99.20 |
0.1786 times |
Wed 01 October 2025 |
99.06 (-0.01%) |
99.07 |
99.06 - 99.07 |
0.8929 times |
Weekly price and charts GoiTbill Strong weekly Stock price targets for GoiTbill 91D131125_TB are 99.7 and 99.7 | Weekly Target 1 | 99.7 | | Weekly Target 2 | 99.7 | | Weekly Target 3 | 99.7 | | Weekly Target 4 | 99.7 | | Weekly Target 5 | 99.7 |
Weekly price and volumes for Goi Tbill
| Date |
Closing |
Open |
Range |
Volume |
Tue 28 October 2025 |
99.70 (0.1%) |
99.70 |
99.70 - 99.70 |
0.6774 times |
Fri 24 October 2025 |
99.60 (0.2%) |
99.40 |
99.40 - 99.60 |
0.5081 times |
Fri 17 October 2025 |
99.40 (0.18%) |
99.35 |
99.30 - 99.51 |
1.8629 times |
Tue 07 October 2025 |
99.22 (0.16%) |
99.20 |
99.20 - 99.22 |
0.1129 times |
Wed 01 October 2025 |
99.06 (-0.04%) |
99.10 |
99.06 - 99.10 |
0.5081 times |
Thu 25 September 2025 |
99.10 (0.1%) |
99.00 |
99.00 - 99.10 |
0.4516 times |
Fri 19 September 2025 |
99.00 (0%) |
98.87 |
98.78 - 99.15 |
2.879 times |
Tue 28 October 2025 |
(0%) |
|
- |
0 times |

Monthly price and charts GoiTbill Strong monthly Stock price targets for GoiTbill 91D131125_TB are 99.38 and 100.02 | Monthly Target 1 | 98.85 | | Monthly Target 2 | 99.27 | | Monthly Target 3 | 99.486666666667 | | Monthly Target 4 | 99.91 | | Monthly Target 5 | 100.13 |
Monthly price and volumes Goi Tbill
| Date |
Closing |
Open |
Range |
Volume |
Tue 28 October 2025 |
99.70 (0.64%) |
99.07 |
99.06 - 99.70 |
1.3358 times |
Tue 30 September 2025 |
99.07 (0.68%) |
98.87 |
98.78 - 99.15 |
1.3796 times |
Thu 21 August 2025 |
98.40 (0%) |
98.00 |
97.01 - 98.40 |
0.2847 times |
Tue 28 October 2025 |
(0%) |
|
- |
0 times |

DMA SMA EMA moving averages of Goi Tbill 91D131125_TB
DMA (daily moving average) of Goi Tbill 91D131125_TB
| DMA period | DMA value | | 5 day DMA | 99.57 | | 12 day DMA | 99.39 | | 20 day DMA | 99.27 | | 35 day DMA | | | 50 day DMA | | | 100 day DMA | | | 150 day DMA | | | 200 day DMA | | EMA (exponential moving average) of Goi Tbill 91D131125_TB
| EMA period | EMA current | EMA prev | EMA prev2 | | 5 day EMA | 99.58 | 99.52 | 99.48 | | 12 day EMA | 99.4 | 99.35 | 99.31 | | 20 day EMA | 99.24 | 99.19 | 99.15 | | 35 day EMA | 0 | 0 | 0 | | 50 day EMA | 0 | 0 | 0 |
SMA (simple moving average) of Goi Tbill 91D131125_TB
| SMA period | SMA current | SMA prev | SMA prev2 | | 5 day SMA | 99.57 | 99.49 | 99.47 | | 12 day SMA | 99.39 | 99.34 | 99.3 | | 20 day SMA | 99.27 | 99.23 | 99.19 | | 35 day SMA | | 50 day SMA | | 100 day SMA | | 150 day SMA | | 200 day SMA |
|
|
