GoiTbill 91D120625_TB full analysis,charts,indicators,moving averages,SMA,DMA,EMA,ADX,MACD,RSIGoi Tbill 91D120625_TB WideScreen charts, DMA,SMA,EMA technical analysis, forecast prediction, by indicators ADX,MACD,RSI,CCI NSE stock exchange
Daily price and charts and targets GoiTbill Strong Daily Stock price targets for GoiTbill 91D120625_TB are 99.78 and 99.83 | Daily Target 1 | 99.77 | | Daily Target 2 | 99.78 | | Daily Target 3 | 99.816666666667 | | Daily Target 4 | 99.83 | | Daily Target 5 | 99.87 |
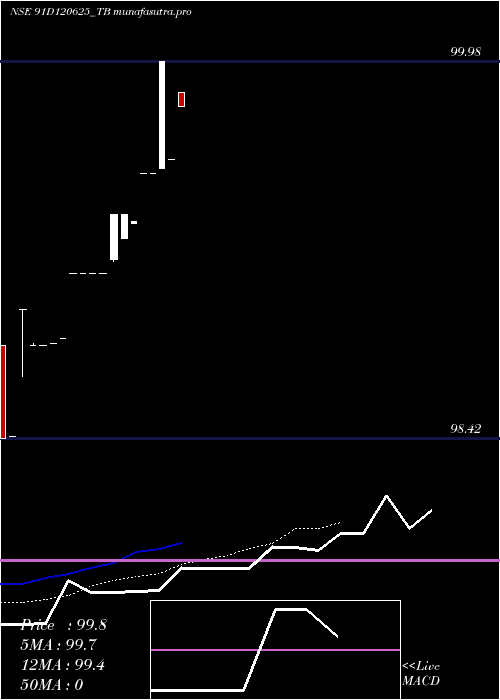
Daily price and volume Goi Tbill
| Date |
Closing |
Open |
Range |
Volume |
| Mon 09 June 2025 |
99.80 (0.22%) |
99.85 |
99.80 - 99.85 |
1.25 times |
| Fri 23 May 2025 |
99.58 (-0.4%) |
99.58 |
99.58 - 99.58 |
0.4167 times |
| Wed 21 May 2025 |
99.98 (0.46%) |
99.54 |
99.54 - 99.98 |
0.4167 times |
| Tue 20 May 2025 |
99.52 (0%) |
99.52 |
99.52 - 99.52 |
0.2083 times |
| Mon 19 May 2025 |
99.52 (0.2%) |
99.52 |
99.52 - 99.52 |
0.2083 times |
| Tue 13 May 2025 |
99.32 (-0.03%) |
99.31 |
99.31 - 99.32 |
0.4167 times |
| Tue 06 May 2025 |
99.35 (0%) |
99.25 |
99.25 - 99.35 |
1.25 times |
| Mon 05 May 2025 |
99.35 (0.25%) |
99.16 |
99.15 - 99.35 |
2.2917 times |
| Fri 02 May 2025 |
99.10 (0%) |
99.10 |
99.10 - 99.10 |
3.3333 times |
| Wed 30 April 2025 |
99.10 (0%) |
99.10 |
99.10 - 99.10 |
0.2083 times |
| Tue 29 April 2025 |
99.10 (0%) |
99.10 |
99.10 - 99.10 |
0.625 times |
Weekly price and charts GoiTbill Strong weekly Stock price targets for GoiTbill 91D120625_TB are 99.78 and 99.83 | Weekly Target 1 | 99.77 | | Weekly Target 2 | 99.78 | | Weekly Target 3 | 99.816666666667 | | Weekly Target 4 | 99.83 | | Weekly Target 5 | 99.87 |
Weekly price and volumes for Goi Tbill
| Date |
Closing |
Open |
Range |
Volume |
| Mon 09 June 2025 |
99.80 (0.22%) |
99.85 |
99.80 - 99.85 |
0.3103 times |
| Fri 23 May 2025 |
99.58 (0.26%) |
99.52 |
99.52 - 99.98 |
0.3103 times |
| Tue 13 May 2025 |
99.32 (-0.03%) |
99.31 |
99.31 - 99.32 |
0.1034 times |
| Tue 06 May 2025 |
99.35 (0.25%) |
99.16 |
99.15 - 99.35 |
0.8793 times |
| Fri 02 May 2025 |
99.10 (0.27%) |
99.10 |
99.10 - 99.10 |
1.6035 times |
| Fri 25 April 2025 |
98.83 (0%) |
98.80 |
98.80 - 98.83 |
2.7931 times |
| Sat 14 June 2025 |
(0%) |
|
- |
0 times |

Monthly price and charts GoiTbill Strong monthly Stock price targets for GoiTbill 91D120625_TB are 99.78 and 99.83 | Monthly Target 1 | 99.77 | | Monthly Target 2 | 99.78 | | Monthly Target 3 | 99.816666666667 | | Monthly Target 4 | 99.83 | | Monthly Target 5 | 99.87 |
Monthly price and volumes Goi Tbill
| Date |
Closing |
Open |
Range |
Volume |
| Mon 09 June 2025 |
99.80 (0.22%) |
99.85 |
99.80 - 99.85 |
0.1146 times |
| Fri 23 May 2025 |
99.58 (0.48%) |
99.10 |
99.10 - 99.98 |
0.7834 times |
| Wed 30 April 2025 |
99.10 (0%) |
98.80 |
98.42 - 99.10 |
2.1019 times |
| Sat 14 June 2025 |
(0%) |
|
- |
0 times |

DMA SMA EMA moving averages of Goi Tbill 91D120625_TB
DMA (daily moving average) of Goi Tbill 91D120625_TB
| DMA period | DMA value | | 5 day DMA | 99.68 | | 12 day DMA | 99.4 | | 20 day DMA | | | 35 day DMA | | | 50 day DMA | | | 100 day DMA | | | 150 day DMA | | | 200 day DMA | | EMA (exponential moving average) of Goi Tbill 91D120625_TB
| EMA period | EMA current | EMA prev | EMA prev2 | | 5 day EMA | 99.66 | 99.59 | 99.59 | | 12 day EMA | 99.4 | 99.33 | 99.29 | | 20 day EMA | 0 | 0 | 0 | | 35 day EMA | 0 | 0 | 0 | | 50 day EMA | 0 | 0 | 0 |
SMA (simple moving average) of Goi Tbill 91D120625_TB
| SMA period | SMA current | SMA prev | SMA prev2 | | 5 day SMA | 99.68 | 99.58 | 99.54 | | 12 day SMA | 99.4 | 99.32 | 99.26 | | 20 day SMA | | 35 day SMA | | 50 day SMA | | 100 day SMA | | 150 day SMA | | 200 day SMA |
|
|
