GoiTbill 91D111225_TB full analysis,charts,indicators,moving averages,SMA,DMA,EMA,ADX,MACD,RSIGoi Tbill 91D111225_TB WideScreen charts, DMA,SMA,EMA technical analysis, forecast prediction, by indicators ADX,MACD,RSI,CCI NSE stock exchange
Daily price and charts and targets GoiTbill Strong Daily Stock price targets for GoiTbill 91D111225_TB are 99.14 and 99.41 | Daily Target 1 | 98.94 | | Daily Target 2 | 99.07 | | Daily Target 3 | 99.21 | | Daily Target 4 | 99.34 | | Daily Target 5 | 99.48 |
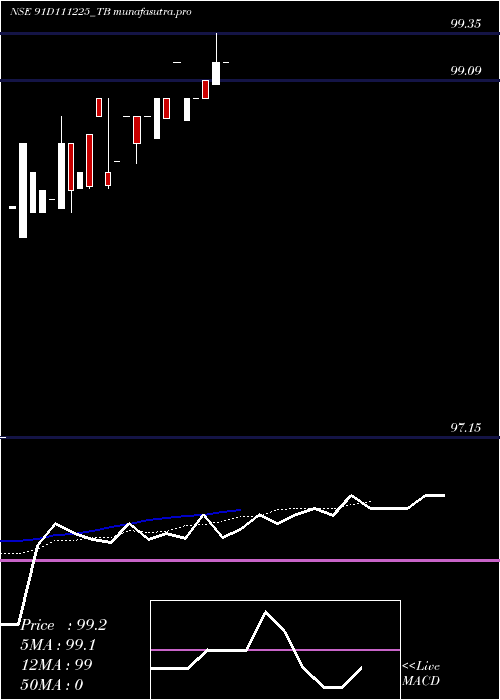
Daily price and volume Goi Tbill
| Date |
Closing |
Open |
Range |
Volume |
Tue 28 October 2025 |
99.20 (0.2%) |
99.08 |
99.08 - 99.35 |
3.1606 times |
Mon 27 October 2025 |
99.00 (0%) |
99.10 |
99.00 - 99.10 |
0.5181 times |
Fri 24 October 2025 |
99.00 (0%) |
99.00 |
99.00 - 99.00 |
0.0518 times |
Thu 23 October 2025 |
99.00 (-0.2%) |
98.88 |
98.88 - 99.00 |
0.4145 times |
Tue 21 October 2025 |
99.20 (0.31%) |
99.20 |
99.20 - 99.20 |
2.9016 times |
Mon 20 October 2025 |
98.89 (-0.11%) |
99.00 |
98.89 - 99.00 |
0.1036 times |
Wed 15 October 2025 |
99.00 (0.1%) |
98.78 |
98.78 - 99.00 |
0.2591 times |
Thu 09 October 2025 |
98.90 (0.15%) |
98.90 |
98.90 - 98.90 |
0.9326 times |
Wed 08 October 2025 |
98.75 (-0.15%) |
98.90 |
98.65 - 98.90 |
1.5026 times |
Tue 07 October 2025 |
98.90 (0.24%) |
98.90 |
98.90 - 98.90 |
0.1554 times |
Mon 06 October 2025 |
98.66 (0.13%) |
98.66 |
98.66 - 98.66 |
0.0518 times |
Weekly price and charts GoiTbill Strong weekly Stock price targets for GoiTbill 91D111225_TB are 99.1 and 99.45 | Weekly Target 1 | 98.83 | | Weekly Target 2 | 99.02 | | Weekly Target 3 | 99.183333333333 | | Weekly Target 4 | 99.37 | | Weekly Target 5 | 99.53 |
Weekly price and volumes for Goi Tbill
| Date |
Closing |
Open |
Range |
Volume |
Tue 28 October 2025 |
99.20 (0.2%) |
99.10 |
99.00 - 99.35 |
1.4119 times |
Fri 24 October 2025 |
99.00 (0%) |
99.00 |
98.88 - 99.20 |
1.3324 times |
Wed 15 October 2025 |
99.00 (0.1%) |
98.78 |
98.78 - 99.00 |
0.0994 times |
Thu 09 October 2025 |
98.90 (0.38%) |
98.66 |
98.65 - 98.90 |
1.0142 times |
Fri 03 October 2025 |
98.53 (0.03%) |
98.51 |
98.51 - 99.00 |
0.2784 times |
Fri 26 September 2025 |
98.50 (-0.25%) |
98.38 |
98.38 - 98.90 |
0.5369 times |
Thu 18 September 2025 |
98.75 (0%) |
98.40 |
98.24 - 98.75 |
2.3267 times |
Tue 28 October 2025 |
(0%) |
|
- |
0 times |

Monthly price and charts GoiTbill Strong monthly Stock price targets for GoiTbill 91D111225_TB are 98.86 and 99.7 | Monthly Target 1 | 98.18 | | Monthly Target 2 | 98.69 | | Monthly Target 3 | 99.02 | | Monthly Target 4 | 99.53 | | Monthly Target 5 | 99.86 |
Monthly price and volumes Goi Tbill
| Date |
Closing |
Open |
Range |
Volume |
Tue 28 October 2025 |
99.20 (0.69%) |
99.00 |
98.51 - 99.35 |
1.1388 times |
Tue 30 September 2025 |
98.52 (0%) |
97.15 |
97.15 - 98.90 |
0.8612 times |
Tue 28 October 2025 |
(0%) |
|
- |
0 times |

DMA SMA EMA moving averages of Goi Tbill 91D111225_TB
DMA (daily moving average) of Goi Tbill 91D111225_TB
| DMA period | DMA value | | 5 day DMA | 99.08 | | 12 day DMA | 98.92 | | 20 day DMA | 98.79 | | 35 day DMA | | | 50 day DMA | | | 100 day DMA | | | 150 day DMA | | | 200 day DMA | | EMA (exponential moving average) of Goi Tbill 91D111225_TB
| EMA period | EMA current | EMA prev | EMA prev2 | | 5 day EMA | 99.06 | 98.99 | 98.99 | | 12 day EMA | 98.93 | 98.88 | 98.86 | | 20 day EMA | 98.76 | 98.71 | 98.68 | | 35 day EMA | 0 | 0 | 0 | | 50 day EMA | 0 | 0 | 0 |
SMA (simple moving average) of Goi Tbill 91D111225_TB
| SMA period | SMA current | SMA prev | SMA prev2 | | 5 day SMA | 99.08 | 99.02 | 99.02 | | 12 day SMA | 98.92 | 98.89 | 98.85 | | 20 day SMA | 98.79 | 98.77 | | 35 day SMA | | 50 day SMA | | 100 day SMA | | 150 day SMA | | 200 day SMA |
|
|
