GoiTbill 91D110725_TB full analysis,charts,indicators,moving averages,SMA,DMA,EMA,ADX,MACD,RSIGoi Tbill 91D110725_TB WideScreen charts, DMA,SMA,EMA technical analysis, forecast prediction, by indicators ADX,MACD,RSI,CCI NSE stock exchange
Daily price and charts and targets GoiTbill Strong Daily Stock price targets for GoiTbill 91D110725_TB are 99.18 and 99.18 | Daily Target 1 | 99.18 | | Daily Target 2 | 99.18 | | Daily Target 3 | 99.18 | | Daily Target 4 | 99.18 | | Daily Target 5 | 99.18 |
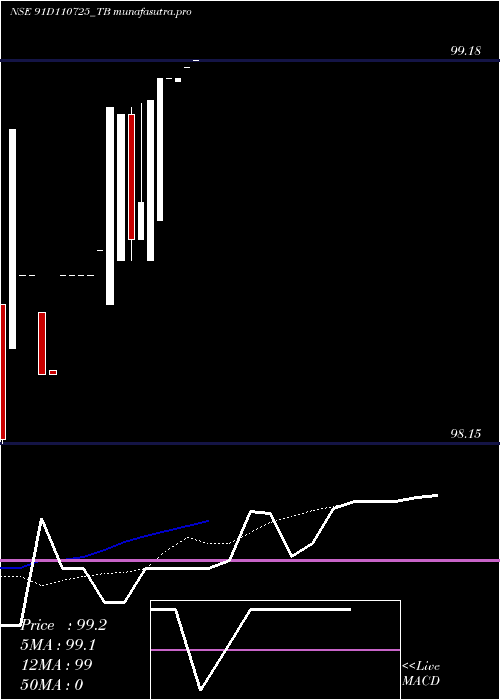
Daily price and volume Goi Tbill
| Date |
Closing |
Open |
Range |
Volume |
Fri 23 May 2025 |
99.18 (0.02%) |
99.18 |
99.18 - 99.18 |
0.0581 times |
Thu 22 May 2025 |
99.16 (0.03%) |
99.16 |
99.16 - 99.16 |
0.0581 times |
Wed 21 May 2025 |
99.13 (0%) |
99.12 |
99.12 - 99.13 |
0.2326 times |
Tue 20 May 2025 |
99.13 (0%) |
99.13 |
99.13 - 99.13 |
0.0581 times |
Mon 19 May 2025 |
99.13 (0.06%) |
98.75 |
98.75 - 99.13 |
0.1744 times |
Fri 16 May 2025 |
99.07 (0.27%) |
98.64 |
98.64 - 99.07 |
0.2326 times |
Thu 15 May 2025 |
98.80 (0.1%) |
98.70 |
98.70 - 99.06 |
0.407 times |
Wed 14 May 2025 |
98.70 (-0.34%) |
99.04 |
98.64 - 99.05 |
1.1628 times |
Tue 13 May 2025 |
99.04 (-0.01%) |
98.64 |
98.64 - 99.04 |
4.8256 times |
Mon 12 May 2025 |
99.05 (0.39%) |
98.52 |
98.52 - 99.05 |
2.7907 times |
Fri 09 May 2025 |
98.67 (0.07%) |
98.67 |
98.67 - 98.67 |
0.1744 times |
Weekly price and charts GoiTbill Strong weekly Stock price targets for GoiTbill 91D110725_TB are 98.97 and 99.4 | Weekly Target 1 | 98.61 | | Weekly Target 2 | 98.89 | | Weekly Target 3 | 99.036666666667 | | Weekly Target 4 | 99.32 | | Weekly Target 5 | 99.47 |
Weekly price and volumes for Goi Tbill
| Date |
Closing |
Open |
Range |
Volume |
Fri 23 May 2025 |
99.18 (0.11%) |
98.75 |
98.75 - 99.18 |
0.1623 times |
Fri 16 May 2025 |
99.07 (0.41%) |
98.52 |
98.52 - 99.07 |
2.6299 times |
Fri 09 May 2025 |
98.67 (0.35%) |
98.60 |
98.60 - 98.67 |
0.3247 times |
Fri 02 May 2025 |
98.33 (-0.27%) |
98.60 |
98.33 - 98.60 |
1.1851 times |
Fri 25 April 2025 |
98.60 (0%) |
98.52 |
98.15 - 99.00 |
0.6981 times |
Sat 24 May 2025 |
(0%) |
|
- |
0 times |

Monthly price and charts GoiTbill Strong monthly Stock price targets for GoiTbill 91D110725_TB are 98.76 and 99.61 | Monthly Target 1 | 98.05 | | Monthly Target 2 | 98.61 | | Monthly Target 3 | 98.896666666667 | | Monthly Target 4 | 99.46 | | Monthly Target 5 | 99.75 |
Monthly price and volumes Goi Tbill
| Date |
Closing |
Open |
Range |
Volume |
Fri 23 May 2025 |
99.18 (0.86%) |
98.34 |
98.33 - 99.18 |
1.5325 times |
Wed 30 April 2025 |
98.33 (0%) |
98.52 |
98.15 - 99.00 |
0.4675 times |
Sat 24 May 2025 |
(0%) |
|
- |
0 times |

DMA SMA EMA moving averages of Goi Tbill 91D110725_TB
DMA (daily moving average) of Goi Tbill 91D110725_TB
| DMA period | DMA value | | 5 day DMA | 99.15 | | 12 day DMA | 98.97 | | 20 day DMA | | | 35 day DMA | | | 50 day DMA | | | 100 day DMA | | | 150 day DMA | | | 200 day DMA | | EMA (exponential moving average) of Goi Tbill 91D110725_TB
| EMA period | EMA current | EMA prev | EMA prev2 | | 5 day EMA | 99.12 | 99.09 | 99.06 | | 12 day EMA | 98.98 | 98.94 | 98.9 | | 20 day EMA | 98.81 | 98.77 | | 35 day EMA | 0 | 0 | 0 | | 50 day EMA | 0 | 0 | 0 |
SMA (simple moving average) of Goi Tbill 91D110725_TB
| SMA period | SMA current | SMA prev | SMA prev2 | | 5 day SMA | 99.15 | 99.12 | 99.05 | | 12 day SMA | 98.97 | 98.92 | 98.88 | | 20 day SMA | | 35 day SMA | | 50 day SMA | | 100 day SMA | | 150 day SMA | | 200 day SMA |
|
|
