GoiTbill 91D050625_TB full analysis,charts,indicators,moving averages,SMA,DMA,EMA,ADX,MACD,RSIGoi Tbill 91D050625_TB WideScreen charts, DMA,SMA,EMA technical analysis, forecast prediction, by indicators ADX,MACD,RSI,CCI NSE stock exchange
Daily price and charts and targets GoiTbill Strong Daily Stock price targets for GoiTbill 91D050625_TB are 99.52 and 99.52 | Daily Target 1 | 99.52 | | Daily Target 2 | 99.52 | | Daily Target 3 | 99.52 | | Daily Target 4 | 99.52 | | Daily Target 5 | 99.52 |
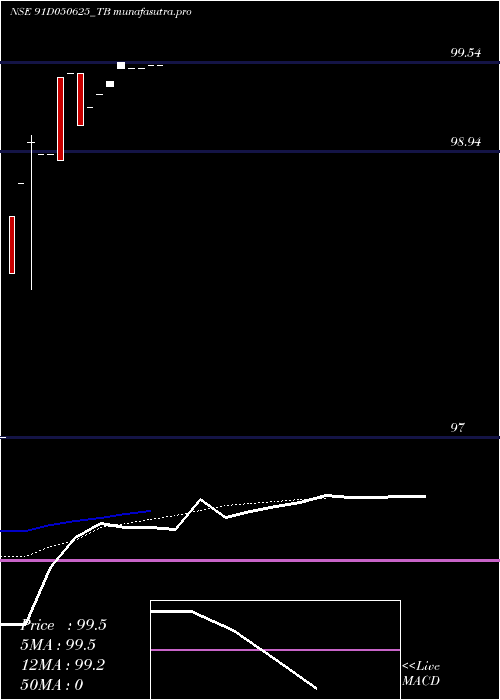
Daily price and volume Goi Tbill
| Date |
Closing |
Open |
Range |
Volume |
Fri 23 May 2025 |
99.52 (0%) |
99.52 |
99.52 - 99.52 |
0.0885 times |
Thu 22 May 2025 |
99.52 (0.02%) |
99.52 |
99.52 - 99.52 |
0.0885 times |
Wed 21 May 2025 |
99.50 (0%) |
99.50 |
99.50 - 99.50 |
0.9735 times |
Tue 20 May 2025 |
99.50 (-0.04%) |
99.50 |
99.50 - 99.50 |
0.885 times |
Wed 14 May 2025 |
99.54 (0.13%) |
99.50 |
99.50 - 99.54 |
3.5398 times |
Tue 13 May 2025 |
99.41 (0.09%) |
99.38 |
99.38 - 99.41 |
2.4779 times |
Mon 12 May 2025 |
99.32 (0.09%) |
99.32 |
99.32 - 99.32 |
0.0885 times |
Fri 09 May 2025 |
99.23 (0.11%) |
99.23 |
99.23 - 99.23 |
0.354 times |
Mon 05 May 2025 |
99.12 (-0.35%) |
99.47 |
99.12 - 99.47 |
0.6195 times |
Fri 02 May 2025 |
99.47 (0.6%) |
99.47 |
99.47 - 99.47 |
0.885 times |
Wed 30 April 2025 |
98.88 (-0.04%) |
99.44 |
98.88 - 99.44 |
0.6195 times |
Weekly price and charts GoiTbill Strong weekly Stock price targets for GoiTbill 91D050625_TB are 99.51 and 99.53 | Weekly Target 1 | 99.49 | | Weekly Target 2 | 99.51 | | Weekly Target 3 | 99.513333333333 | | Weekly Target 4 | 99.53 | | Weekly Target 5 | 99.53 |
Weekly price and volumes for Goi Tbill
| Date |
Closing |
Open |
Range |
Volume |
Fri 23 May 2025 |
99.52 (-0.02%) |
99.50 |
99.50 - 99.52 |
0.3855 times |
Wed 14 May 2025 |
99.54 (0.31%) |
99.32 |
99.32 - 99.54 |
1.1564 times |
Fri 09 May 2025 |
99.23 (-0.24%) |
99.47 |
99.12 - 99.47 |
0.1844 times |
Fri 02 May 2025 |
99.47 (0.47%) |
98.92 |
98.88 - 99.47 |
0.4693 times |
Tue 22 April 2025 |
99.00 (0.91%) |
98.72 |
98.00 - 99.05 |
3.7374 times |
Mon 07 April 2025 |
98.11 (0%) |
98.50 |
98.11 - 98.50 |
0.067 times |
Sat 24 May 2025 |
(0%) |
|
- |
0 times |

Monthly price and charts GoiTbill Strong monthly Stock price targets for GoiTbill 91D050625_TB are 99.32 and 99.74 | Monthly Target 1 | 98.97 | | Monthly Target 2 | 99.25 | | Monthly Target 3 | 99.393333333333 | | Monthly Target 4 | 99.67 | | Monthly Target 5 | 99.81 |
Monthly price and volumes Goi Tbill
| Date |
Closing |
Open |
Range |
Volume |
Fri 23 May 2025 |
99.52 (0.65%) |
99.47 |
99.12 - 99.54 |
0.9443 times |
Wed 30 April 2025 |
98.88 (1.94%) |
98.50 |
98.00 - 99.44 |
2.0474 times |
Fri 07 March 2025 |
97.00 (0%) |
97.00 |
97.00 - 97.00 |
0.0084 times |
Sat 24 May 2025 |
(0%) |
|
- |
0 times |

DMA SMA EMA moving averages of Goi Tbill 91D050625_TB
DMA (daily moving average) of Goi Tbill 91D050625_TB
| DMA period | DMA value | | 5 day DMA | 99.52 | | 12 day DMA | 99.33 | | 20 day DMA | | | 35 day DMA | | | 50 day DMA | | | 100 day DMA | | | 150 day DMA | | | 200 day DMA | | EMA (exponential moving average) of Goi Tbill 91D050625_TB
| EMA period | EMA current | EMA prev | EMA prev2 | | 5 day EMA | 99.48 | 99.46 | 99.43 | | 12 day EMA | 99.22 | 99.16 | 99.1 | | 20 day EMA | 0 | 0 | 0 | | 35 day EMA | 0 | 0 | 0 | | 50 day EMA | 0 | 0 | 0 |
SMA (simple moving average) of Goi Tbill 91D050625_TB
| SMA period | SMA current | SMA prev | SMA prev2 | | 5 day SMA | 99.52 | 99.49 | 99.45 | | 12 day SMA | 99.33 | 99.28 | 99.23 | | 20 day SMA | | 35 day SMA | | 50 day SMA | | 100 day SMA | | 150 day SMA | | 200 day SMA |
|
|
