GoiTbill 91D041225_TB full analysis,charts,indicators,moving averages,SMA,DMA,EMA,ADX,MACD,RSIGoi Tbill 91D041225_TB WideScreen charts, DMA,SMA,EMA technical analysis, forecast prediction, by indicators ADX,MACD,RSI,CCI NSE stock exchange
Daily price and charts and targets GoiTbill Strong Daily Stock price targets for GoiTbill 91D041225_TB are 99.16 and 99.33 | Daily Target 1 | 99.12 | | Daily Target 2 | 99.19 | | Daily Target 3 | 99.293333333333 | | Daily Target 4 | 99.36 | | Daily Target 5 | 99.46 |
Daily price and volume Goi Tbill
| Date |
Closing |
Open |
Range |
Volume |
Wed 29 October 2025 |
99.25 (-0.13%) |
99.40 |
99.23 - 99.40 |
0.8333 times |
Tue 28 October 2025 |
99.38 (-0.02%) |
99.23 |
99.23 - 99.40 |
1.7333 times |
Mon 27 October 2025 |
99.40 (0%) |
99.40 |
99.40 - 99.40 |
0.1667 times |
Fri 24 October 2025 |
99.40 (0.29%) |
99.40 |
99.40 - 99.40 |
1.5 times |
Thu 23 October 2025 |
99.11 (-0.24%) |
99.11 |
99.11 - 99.11 |
0.0333 times |
Mon 20 October 2025 |
99.35 (0.15%) |
99.03 |
99.03 - 99.35 |
0.4667 times |
Fri 17 October 2025 |
99.20 (0.1%) |
99.20 |
99.15 - 99.25 |
0.8667 times |
Thu 16 October 2025 |
99.10 (-0.1%) |
99.10 |
99.10 - 99.10 |
0.0333 times |
Tue 14 October 2025 |
99.20 (0.05%) |
99.15 |
99.15 - 99.20 |
4.2667 times |
Mon 13 October 2025 |
99.15 (0.14%) |
99.01 |
99.01 - 99.15 |
0.1 times |
Fri 10 October 2025 |
99.01 (0.01%) |
99.15 |
99.01 - 99.15 |
0.2667 times |
Weekly price and charts GoiTbill Strong weekly Stock price targets for GoiTbill 91D041225_TB are 99.16 and 99.33 | Weekly Target 1 | 99.12 | | Weekly Target 2 | 99.19 | | Weekly Target 3 | 99.293333333333 | | Weekly Target 4 | 99.36 | | Weekly Target 5 | 99.46 |
Weekly price and volumes for Goi Tbill
| Date |
Closing |
Open |
Range |
Volume |
Wed 29 October 2025 |
99.25 (-0.15%) |
99.40 |
99.23 - 99.40 |
0.2173 times |
Fri 24 October 2025 |
99.40 (0.2%) |
99.03 |
99.03 - 99.40 |
0.159 times |
Fri 17 October 2025 |
99.20 (0.19%) |
99.01 |
99.01 - 99.25 |
0.4187 times |
Fri 10 October 2025 |
99.01 (-0.03%) |
98.78 |
98.78 - 99.15 |
0.2729 times |
Fri 03 October 2025 |
99.04 (0.24%) |
98.80 |
98.68 - 99.05 |
0.5432 times |
Fri 26 September 2025 |
98.80 (-0.05%) |
98.85 |
98.60 - 99.00 |
5.5171 times |
Fri 19 September 2025 |
98.85 (0.15%) |
98.65 |
98.41 - 98.85 |
0.4505 times |
Fri 12 September 2025 |
98.70 (0%) |
98.11 |
98.11 - 98.75 |
0.4213 times |
Wed 29 October 2025 |
(0%) |
|
- |
0 times |

Monthly price and charts GoiTbill Strong monthly Stock price targets for GoiTbill 91D041225_TB are 99.02 and 99.64 | Monthly Target 1 | 98.52 | | Monthly Target 2 | 98.89 | | Monthly Target 3 | 99.143333333333 | | Monthly Target 4 | 99.51 | | Monthly Target 5 | 99.76 |
Monthly price and volumes Goi Tbill
| Date |
Closing |
Open |
Range |
Volume |
Wed 29 October 2025 |
99.25 (0.35%) |
98.90 |
98.78 - 99.40 |
0.3642 times |
Tue 30 September 2025 |
98.90 (0%) |
97.50 |
97.00 - 99.00 |
1.6358 times |
Wed 29 October 2025 |
(0%) |
|
- |
0 times |

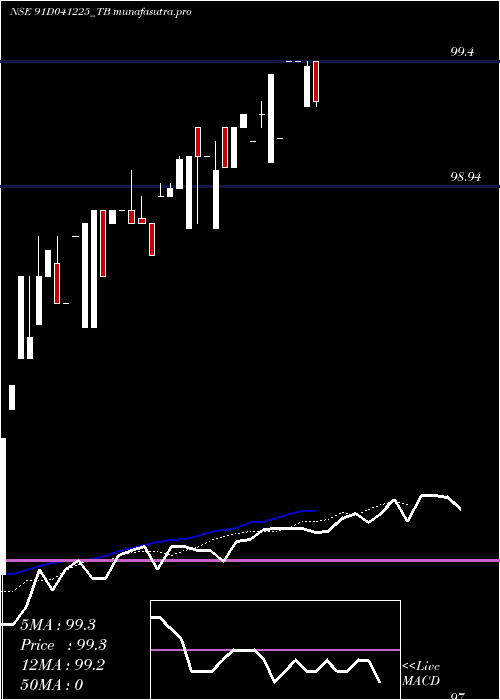
DMA SMA EMA moving averages of Goi Tbill 91D041225_TB
DMA (daily moving average) of Goi Tbill 91D041225_TB
| DMA period | DMA value | | 5 day DMA | 99.31 | | 12 day DMA | 99.21 | | 20 day DMA | 99.1 | | 35 day DMA | | | 50 day DMA | | | 100 day DMA | | | 150 day DMA | | | 200 day DMA | | EMA (exponential moving average) of Goi Tbill 91D041225_TB
| EMA period | EMA current | EMA prev | EMA prev2 | | 5 day EMA | 99.3 | 99.33 | 99.3 | | 12 day EMA | 99.22 | 99.22 | 99.19 | | 20 day EMA | 99.1 | 99.08 | 99.05 | | 35 day EMA | 98.89 | | 50 day EMA | 0 | 0 | 0 |
SMA (simple moving average) of Goi Tbill 91D041225_TB
| SMA period | SMA current | SMA prev | SMA prev2 | | 5 day SMA | 99.31 | 99.33 | 99.29 | | 12 day SMA | 99.21 | 99.2 | 99.17 | | 20 day SMA | 99.1 | 99.08 | 99.05 | | 35 day SMA | | 50 day SMA | | 100 day SMA | | 150 day SMA | | 200 day SMA |
|
|
