UnsRed 915SCL26_NE full analysis,charts,indicators,moving averages,SMA,DMA,EMA,ADX,MACD,RSIUns Red 915SCL26_NE WideScreen charts, DMA,SMA,EMA technical analysis, forecast prediction, by indicators ADX,MACD,RSI,CCI NSE stock exchange
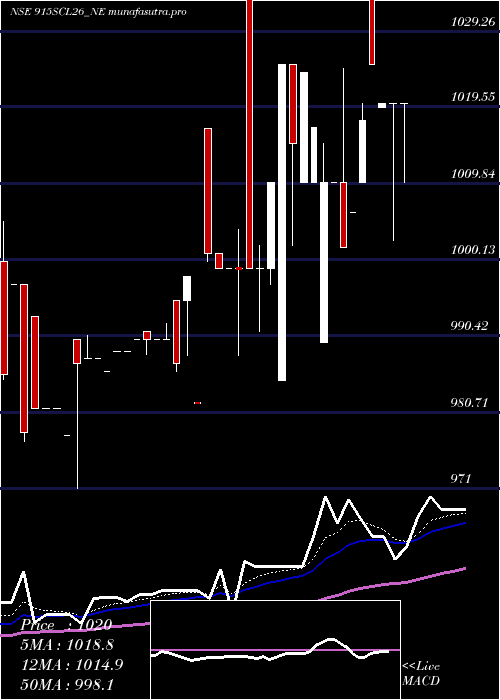
Daily price and charts and targets UnsRed Strong Daily Stock price targets for UnsRed 915SCL26_NE are 994 and 994 | Daily Target 1 | 994 | | Daily Target 2 | 994 | | Daily Target 3 | 994 | | Daily Target 4 | 994 | | Daily Target 5 | 994 |
Daily price and volume Uns Red
| Date |
Closing |
Open |
Range |
Volume |
Tue 28 October 2025 |
994.00 (0.1%) |
994.00 |
994.00 - 994.00 |
0.1302 times |
Mon 27 October 2025 |
993.00 (0.3%) |
991.00 |
991.00 - 993.00 |
4.1492 times |
Fri 24 October 2025 |
990.01 (0.51%) |
990.00 |
990.00 - 998.00 |
1.5905 times |
Thu 23 October 2025 |
985.00 (1.42%) |
985.00 |
985.00 - 985.00 |
0.0825 times |
Tue 21 October 2025 |
971.20 (-0.71%) |
971.20 |
971.20 - 971.20 |
0.0032 times |
Fri 17 October 2025 |
978.15 (-0.7%) |
975.00 |
975.00 - 979.00 |
1.2032 times |
Thu 16 October 2025 |
985.00 (0.28%) |
990.00 |
982.51 - 990.00 |
0.2381 times |
Tue 14 October 2025 |
982.22 (-0.08%) |
985.00 |
982.21 - 985.00 |
0.254 times |
Mon 13 October 2025 |
983.00 (-1.7%) |
982.10 |
982.00 - 985.00 |
2.346 times |
Fri 10 October 2025 |
999.99 (1.63%) |
999.99 |
999.99 - 999.99 |
0.0032 times |
Thu 09 October 2025 |
984.00 (-1.4%) |
925.41 |
925.41 - 997.99 |
0.0222 times |
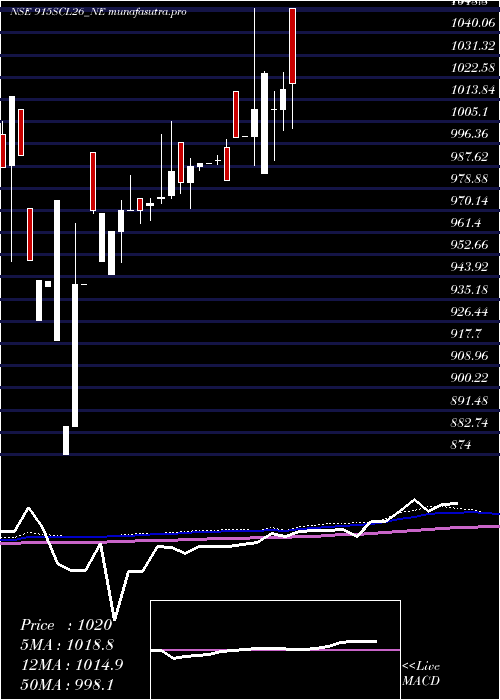
Weekly price and charts UnsRed Strong weekly Stock price targets for UnsRed 915SCL26_NE are 992.5 and 995.5 | Weekly Target 1 | 990 | | Weekly Target 2 | 992 | | Weekly Target 3 | 993 | | Weekly Target 4 | 995 | | Weekly Target 5 | 996 |
Weekly price and volumes for Uns Red
| Date |
Closing |
Open |
Range |
Volume |
Tue 28 October 2025 |
994.00 (0.4%) |
991.00 |
991.00 - 994.00 |
0.8719 times |
Fri 24 October 2025 |
990.01 (1.21%) |
971.20 |
971.20 - 998.00 |
0.3415 times |
Fri 17 October 2025 |
978.15 (-2.18%) |
982.10 |
975.00 - 990.00 |
0.8234 times |
Fri 10 October 2025 |
999.99 (1.42%) |
990.00 |
925.41 - 999.99 |
0.3247 times |
Fri 03 October 2025 |
986.00 (0.1%) |
985.00 |
961.50 - 995.00 |
1.0032 times |
Fri 26 September 2025 |
985.00 (0%) |
987.00 |
970.00 - 987.00 |
0.7309 times |
Fri 19 September 2025 |
985.00 (0.2%) |
983.00 |
970.10 - 998.00 |
0.8118 times |
Fri 12 September 2025 |
983.00 (-7.09%) |
1084.45 |
983.00 - 1084.45 |
1.2846 times |
Fri 05 September 2025 |
1058.00 (0.28%) |
1057.00 |
1004.00 - 1079.79 |
1.216 times |
Fri 29 August 2025 |
1055.00 (0.09%) |
968.00 |
968.00 - 1060.00 |
2.5918 times |
Fri 22 August 2025 |
1054.00 (-0.19%) |
1054.02 |
1049.43 - 1056.00 |
2.8577 times |
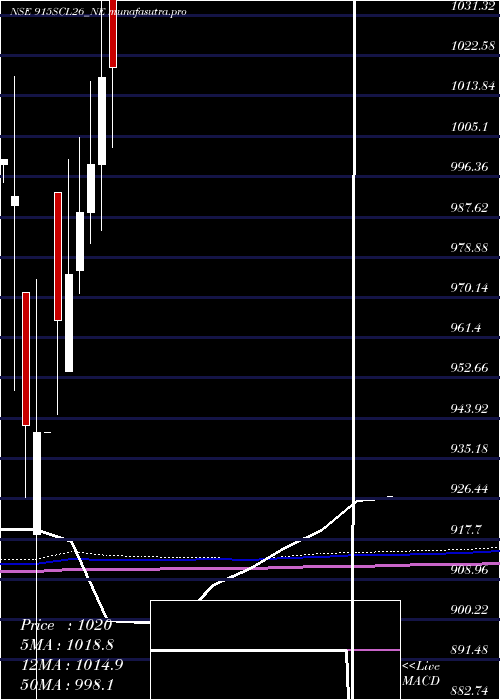
Monthly price and charts UnsRed Strong monthly Stock price targets for UnsRed 915SCL26_NE are 959.71 and 1034.29 | Monthly Target 1 | 898.55 | | Monthly Target 2 | 946.28 | | Monthly Target 3 | 973.13333333333 | | Monthly Target 4 | 1020.86 | | Monthly Target 5 | 1047.71 |
Monthly price and volumes Uns Red
| Date |
Closing |
Open |
Range |
Volume |
Tue 28 October 2025 |
994.00 (1.46%) |
961.50 |
925.41 - 999.99 |
0.6864 times |
Tue 30 September 2025 |
979.66 (-7.14%) |
1057.00 |
970.00 - 1084.45 |
1.0975 times |
Fri 29 August 2025 |
1055.00 (0.48%) |
1048.91 |
968.00 - 1060.00 |
1.7145 times |
Thu 31 July 2025 |
1050.00 (2.04%) |
1030.00 |
1002.98 - 1229.00 |
1.157 times |
Mon 30 June 2025 |
1029.00 (1.54%) |
970.01 |
929.17 - 1030.00 |
1.4869 times |
Tue 27 May 2025 |
1013.42 (-0.44%) |
1049.80 |
1002.55 - 1049.80 |
0.2852 times |
Wed 30 April 2025 |
1017.89 (1.89%) |
999.10 |
984.75 - 1049.80 |
0.6745 times |
Fri 28 March 2025 |
999.00 (1.06%) |
988.50 |
981.80 - 1016.92 |
0.1263 times |
Fri 28 February 2025 |
988.50 (1.37%) |
976.00 |
971.00 - 1005.00 |
0.4132 times |
Fri 31 January 2025 |
975.10 (1.05%) |
954.00 |
954.00 - 1000.00 |
2.3584 times |
Tue 31 December 2024 |
965.00 (2.56%) |
992.90 |
944.78 - 992.90 |
0.3153 times |
DMA SMA EMA moving averages of Uns Red 915SCL26_NE
DMA (daily moving average) of Uns Red 915SCL26_NE
| DMA period | DMA value | | 5 day DMA | 986.64 | | 12 day DMA | 986.96 | | 20 day DMA | 984.44 | | 35 day DMA | 996.29 | | 50 day DMA | 1011.86 | | 100 day DMA | 1021.54 | | 150 day DMA | 1012.52 | | 200 day DMA | | EMA (exponential moving average) of Uns Red 915SCL26_NE
| EMA period | EMA current | EMA prev | EMA prev2 | | 5 day EMA | 989.39 | 987.09 | 984.14 | | 12 day EMA | 987.26 | 986.03 | 984.76 | | 20 day EMA | 989.42 | 988.94 | 988.51 | | 35 day EMA | 1000.64 | 1001.03 | 1001.5 | | 50 day EMA | 1012.79 | 1013.56 | 1014.4 |
SMA (simple moving average) of Uns Red 915SCL26_NE
| SMA period | SMA current | SMA prev | SMA prev2 | | 5 day SMA | 986.64 | 983.47 | 981.87 | | 12 day SMA | 986.96 | 986.34 | 985.76 | | 20 day SMA | 984.44 | 983.99 | 983.65 | | 35 day SMA | 996.29 | 998.12 | 999.83 | | 50 day SMA | 1011.86 | 1013.06 | 1014.32 | | 100 day SMA | 1021.54 | 1021.8 | 1022.07 | | 150 day SMA | 1012.52 | 1012.38 | 1012.24 | | 200 day SMA |
|
|
