Unserencd91 910TCAP28_NA full analysis,charts,indicators,moving averages,SMA,DMA,EMA,ADX,MACD,RSIUnserencd9 1 910TCAP28_NA WideScreen charts, DMA,SMA,EMA technical analysis, forecast prediction, by indicators ADX,MACD,RSI,CCI NSE stock exchange
Daily price and charts and targets Unserencd91 Strong Daily Stock price targets for Unserencd91 910TCAP28_NA are 1046.31 and 1051.69 | Daily Target 1 | 1045.41 | | Daily Target 2 | 1047.21 | | Daily Target 3 | 1050.7933333333 | | Daily Target 4 | 1052.59 | | Daily Target 5 | 1056.17 |
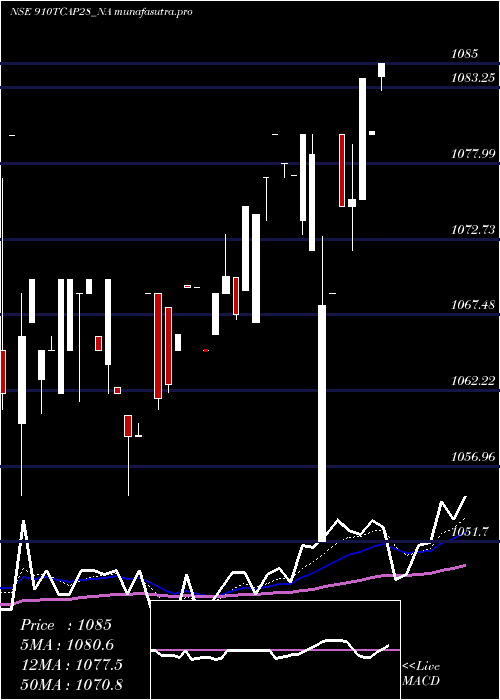
Daily price and volume Unserencd9 1
| Date |
Closing |
Open |
Range |
Volume |
Tue 28 October 2025 |
1049.00 (-0.51%) |
1054.38 |
1049.00 - 1054.38 |
0.1143 times |
Mon 27 October 2025 |
1054.38 (0.9%) |
1046.00 |
1045.00 - 1056.00 |
4.1506 times |
Fri 24 October 2025 |
1045.00 (-0.29%) |
1049.75 |
1045.00 - 1049.75 |
1.208 times |
Thu 23 October 2025 |
1048.02 (-0.19%) |
1050.00 |
1045.10 - 1050.00 |
0.2913 times |
Tue 21 October 2025 |
1050.00 (0%) |
1050.00 |
1050.00 - 1050.00 |
0.1053 times |
Mon 20 October 2025 |
1050.00 (-0.41%) |
1047.00 |
1043.00 - 1050.00 |
0.9883 times |
Thu 16 October 2025 |
1054.29 (-0.07%) |
1054.90 |
1054.00 - 1054.90 |
0.0672 times |
Wed 15 October 2025 |
1055.00 (0.64%) |
1032.00 |
1032.00 - 1055.00 |
0.1255 times |
Tue 14 October 2025 |
1048.25 (0.5%) |
1050.00 |
1048.00 - 1051.00 |
2.6132 times |
Mon 13 October 2025 |
1043.05 (0.2%) |
1043.00 |
1043.00 - 1044.00 |
0.3362 times |
Fri 10 October 2025 |
1041.00 (0.09%) |
1041.00 |
1039.05 - 1041.00 |
0.2353 times |
Weekly price and charts Unserencd91 Strong weekly Stock price targets for Unserencd91 910TCAP28_NA are 1047 and 1058 | Weekly Target 1 | 1039 | | Weekly Target 2 | 1044 | | Weekly Target 3 | 1050 | | Weekly Target 4 | 1055 | | Weekly Target 5 | 1061 |
Weekly price and volumes for Unserencd9 1
| Date |
Closing |
Open |
Range |
Volume |
Tue 28 October 2025 |
1049.00 (0.38%) |
1046.00 |
1045.00 - 1056.00 |
1.0886 times |
Fri 24 October 2025 |
1045.00 (-0.88%) |
1047.00 |
1043.00 - 1050.00 |
0.6619 times |
Thu 16 October 2025 |
1054.29 (1.28%) |
1043.00 |
1032.00 - 1055.00 |
0.802 times |
Fri 10 October 2025 |
1041.00 (-0.1%) |
1042.01 |
1036.00 - 1042.99 |
1.4038 times |
Fri 03 October 2025 |
1042.00 (-0.53%) |
1051.50 |
1042.00 - 1051.50 |
0.9176 times |
Fri 26 September 2025 |
1047.50 (-0.33%) |
1055.00 |
1047.00 - 1055.00 |
1.1555 times |
Fri 19 September 2025 |
1051.00 (0.57%) |
1056.90 |
1035.00 - 1070.00 |
1.4719 times |
Fri 12 September 2025 |
1045.00 (-8.24%) |
1142.00 |
1037.10 - 1142.00 |
0.3266 times |
Fri 05 September 2025 |
1138.86 (0.34%) |
1106.62 |
1106.62 - 1157.00 |
1.6595 times |
Fri 29 August 2025 |
1135.00 (0%) |
1125.20 |
1125.20 - 1135.00 |
0.5126 times |
Fri 22 August 2025 |
1135.00 (1.7%) |
1116.00 |
1116.00 - 1145.00 |
0.4405 times |

Monthly price and charts Unserencd91 Strong monthly Stock price targets for Unserencd91 910TCAP28_NA are 1040.5 and 1064.5 | Monthly Target 1 | 1021.67 | | Monthly Target 2 | 1035.33 | | Monthly Target 3 | 1045.6666666667 | | Monthly Target 4 | 1059.33 | | Monthly Target 5 | 1069.67 |
Monthly price and volumes Unserencd9 1
| Date |
Closing |
Open |
Range |
Volume |
Tue 28 October 2025 |
1049.00 (0.12%) |
1047.71 |
1032.00 - 1056.00 |
1.4227 times |
Tue 30 September 2025 |
1047.71 (-7.69%) |
1106.62 |
1035.00 - 1157.00 |
1.5939 times |
Fri 29 August 2025 |
1135.00 (0.8%) |
1143.00 |
1116.00 - 1145.00 |
0.5031 times |
Thu 31 July 2025 |
1126.00 (0.72%) |
1110.00 |
1101.00 - 1152.99 |
0.38 times |
Fri 27 June 2025 |
1118.00 (1.18%) |
1100.00 |
1088.88 - 1150.00 |
0.7767 times |
Fri 30 May 2025 |
1105.00 (1.38%) |
1090.00 |
1083.01 - 1111.00 |
1.0851 times |
Wed 30 April 2025 |
1090.00 (1.11%) |
1077.10 |
1051.70 - 1090.00 |
1.2297 times |
Fri 28 March 2025 |
1078.05 (1.51%) |
1060.50 |
1055.00 - 1080.00 |
1.1786 times |
Fri 28 February 2025 |
1062.00 (-0.28%) |
1065.00 |
1055.00 - 1079.89 |
0.7214 times |
Fri 31 January 2025 |
1065.00 (0.92%) |
1061.00 |
1052.36 - 1099.00 |
1.1088 times |
Tue 31 December 2024 |
1055.30 (0.95%) |
1050.60 |
1048.00 - 1070.00 |
1.0671 times |

DMA SMA EMA moving averages of Unserencd9 1 910TCAP28_NA
DMA (daily moving average) of Unserencd9 1 910TCAP28_NA
| DMA period | DMA value | | 5 day DMA | 1049.28 | | 12 day DMA | 1048.17 | | 20 day DMA | 1046.5 | | 35 day DMA | 1060.05 | | 50 day DMA | 1080.48 | | 100 day DMA | 1096.3 | | 150 day DMA | 1088.27 | | 200 day DMA | 1080.14 | EMA (exponential moving average) of Unserencd9 1 910TCAP28_NA
| EMA period | EMA current | EMA prev | EMA prev2 | | 5 day EMA | 1049.69 | 1050.03 | 1047.86 | | 12 day EMA | 1049.19 | 1049.22 | 1048.28 | | 20 day EMA | 1052.14 | 1052.47 | 1052.27 | | 35 day EMA | 1066.26 | 1067.28 | 1068.04 | | 50 day EMA | 1081.44 | 1082.76 | 1083.92 |
SMA (simple moving average) of Unserencd9 1 910TCAP28_NA
| SMA period | SMA current | SMA prev | SMA prev2 | | 5 day SMA | 1049.28 | 1049.48 | 1049.46 | | 12 day SMA | 1048.17 | 1047.42 | 1046.12 | | 20 day SMA | 1046.5 | 1046.74 | 1046.52 | | 35 day SMA | 1060.05 | 1062.43 | 1065.12 | | 50 day SMA | 1080.48 | 1082.26 | 1083.69 | | 100 day SMA | 1096.3 | 1096.71 | 1097.07 | | 150 day SMA | 1088.27 | 1088.38 | 1088.45 | | 200 day SMA | 1080.14 | 1080.17 | 1080.14 |
|
|
