Bond9 901NHB34_N6 full analysis,charts,indicators,moving averages,SMA,DMA,EMA,ADX,MACD,RSIBond 9 901NHB34_N6 WideScreen charts, DMA,SMA,EMA technical analysis, forecast prediction, by indicators ADX,MACD,RSI,CCI NSE stock exchange
Daily price and charts and targets Bond9 Strong Daily Stock price targets for Bond9 901NHB34_N6 are 6680 and 6720 | Daily Target 1 | 6646.67 | | Daily Target 2 | 6673.33 | | Daily Target 3 | 6686.6666666667 | | Daily Target 4 | 6713.33 | | Daily Target 5 | 6726.67 |
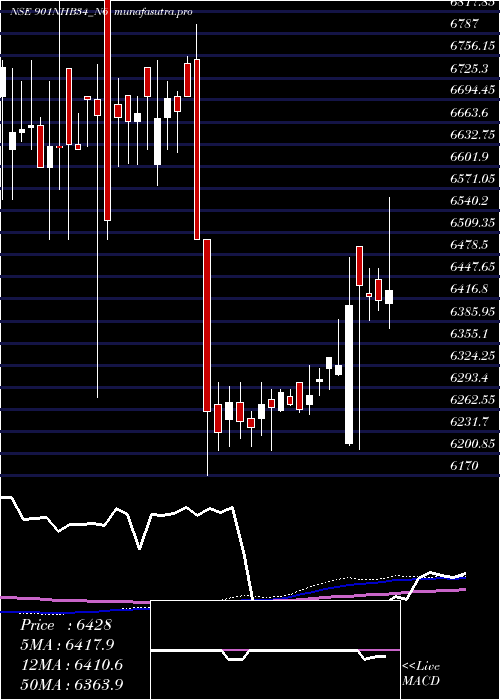
Daily price and volume Bond 9
| Date |
Closing |
Open |
Range |
Volume |
Tue 28 October 2025 |
6700.00 (0.6%) |
6660.00 |
6660.00 - 6700.00 |
0.8687 times |
Fri 24 October 2025 |
6660.00 (-0.52%) |
6695.00 |
6656.00 - 6720.00 |
1.9495 times |
Tue 21 October 2025 |
6695.00 (0.78%) |
6700.00 |
6695.00 - 6700.00 |
0.1313 times |
Fri 17 October 2025 |
6642.95 (0%) |
6642.95 |
6642.95 - 6642.95 |
1.0101 times |
Thu 16 October 2025 |
6642.95 (0.11%) |
6655.00 |
6636.00 - 6655.00 |
0.697 times |
Wed 15 October 2025 |
6635.67 (1.28%) |
6989.84 |
6555.10 - 6989.84 |
3.9394 times |
Tue 14 October 2025 |
6552.00 (0.03%) |
6552.00 |
6552.00 - 6552.00 |
0.303 times |
Mon 13 October 2025 |
6550.10 (0%) |
6550.10 |
6550.10 - 6550.10 |
0.8586 times |
Fri 10 October 2025 |
6550.00 (-2.22%) |
6550.00 |
6550.00 - 6550.00 |
0.0606 times |
Thu 09 October 2025 |
6699.00 (1.23%) |
6699.00 |
6699.00 - 6699.00 |
0.1818 times |
Wed 08 October 2025 |
6617.36 (0.49%) |
6617.92 |
6565.00 - 6620.00 |
2.1919 times |

Weekly price and charts Bond9 Strong weekly Stock price targets for Bond9 901NHB34_N6 are 6680 and 6720 | Weekly Target 1 | 6646.67 | | Weekly Target 2 | 6673.33 | | Weekly Target 3 | 6686.6666666667 | | Weekly Target 4 | 6713.33 | | Weekly Target 5 | 6726.67 |
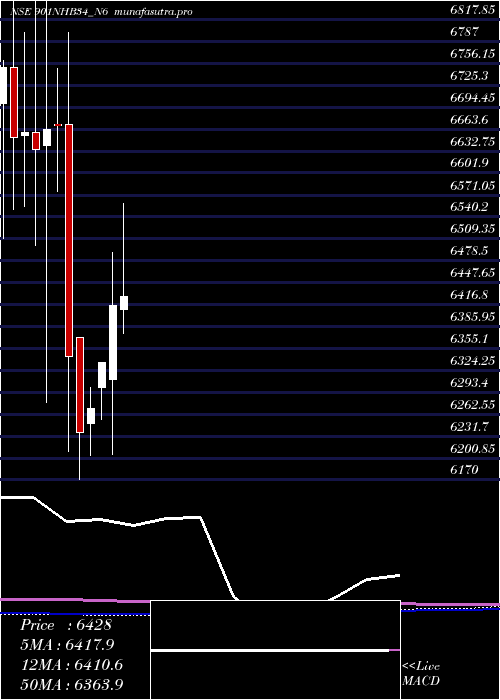
Weekly price and volumes for Bond 9
| Date |
Closing |
Open |
Range |
Volume |
Tue 28 October 2025 |
6700.00 (0.6%) |
6660.00 |
6660.00 - 6700.00 |
0.1663 times |
Fri 24 October 2025 |
6660.00 (0.26%) |
6700.00 |
6656.00 - 6720.00 |
0.3984 times |
Fri 17 October 2025 |
6642.95 (1.42%) |
6550.10 |
6550.10 - 6989.84 |
1.3034 times |
Fri 10 October 2025 |
6550.00 (0.05%) |
6547.00 |
6526.00 - 6699.00 |
1.2551 times |
Fri 03 October 2025 |
6547.00 (0.26%) |
6562.65 |
6420.00 - 6599.00 |
1.8391 times |
Fri 26 September 2025 |
6530.00 (0.15%) |
6520.00 |
6400.00 - 6549.90 |
1.0984 times |
Fri 19 September 2025 |
6520.00 (0.1%) |
6510.00 |
6462.05 - 6524.00 |
1.7559 times |
Fri 12 September 2025 |
6513.55 (0.21%) |
6500.00 |
6430.00 - 6549.00 |
1.8333 times |
Fri 05 September 2025 |
6500.00 (-0.38%) |
6525.00 |
6420.00 - 6580.00 |
0.2495 times |
Fri 29 August 2025 |
6525.00 (1.06%) |
6457.00 |
6450.00 - 6525.00 |
0.1006 times |
Thu 21 August 2025 |
6456.87 (0.79%) |
6450.00 |
6440.00 - 6519.00 |
0.5589 times |
Monthly price and charts Bond9 Strong monthly Stock price targets for Bond9 901NHB34_N6 are 6560 and 7129.84 | Monthly Target 1 | 6133.44 | | Monthly Target 2 | 6416.72 | | Monthly Target 3 | 6703.28 | | Monthly Target 4 | 6986.56 | | Monthly Target 5 | 7273.12 |
Monthly price and volumes Bond 9
| Date |
Closing |
Open |
Range |
Volume |
Tue 28 October 2025 |
6700.00 (3.19%) |
6493.00 |
6420.00 - 6989.84 |
0.5281 times |
Tue 30 September 2025 |
6493.00 (-0.49%) |
6525.00 |
6400.00 - 6599.00 |
0.5831 times |
Fri 29 August 2025 |
6525.00 (1.67%) |
6599.00 |
6360.00 - 6599.00 |
0.1849 times |
Thu 31 July 2025 |
6418.00 (-1.63%) |
6526.50 |
6356.00 - 6526.50 |
0.3109 times |
Mon 30 June 2025 |
6524.34 (1.31%) |
6447.00 |
6249.00 - 6575.00 |
1.1755 times |
Fri 30 May 2025 |
6440.00 (0.39%) |
6410.01 |
6300.00 - 6559.00 |
1.2925 times |
Wed 30 April 2025 |
6415.07 (1.26%) |
6312.00 |
6206.00 - 6490.00 |
1.0048 times |
Fri 28 March 2025 |
6335.00 (1.04%) |
6300.00 |
6255.10 - 6335.00 |
0.6009 times |
Fri 28 February 2025 |
6270.09 (0.53%) |
6249.99 |
6205.00 - 6300.00 |
0.453 times |
Fri 31 January 2025 |
6237.00 (-1.69%) |
6370.00 |
6170.00 - 6370.00 |
3.8663 times |
Tue 31 December 2024 |
6344.27 (-4.86%) |
6670.10 |
6210.00 - 6800.00 |
1.0224 times |
DMA SMA EMA moving averages of Bond 9 901NHB34_N6
DMA (daily moving average) of Bond 9 901NHB34_N6
| DMA period | DMA value | | 5 day DMA | 6668.18 | | 12 day DMA | 6627.5 | | 20 day DMA | 6589.23 | | 35 day DMA | 6553.48 | | 50 day DMA | 6527.24 | | 100 day DMA | 6485.88 | | 150 day DMA | 6440.04 | | 200 day DMA | 6416.98 | EMA (exponential moving average) of Bond 9 901NHB34_N6
| EMA period | EMA current | EMA prev | EMA prev2 | | 5 day EMA | 6666.85 | 6650.28 | 6645.42 | | 12 day EMA | 6630.21 | 6617.52 | 6609.8 | | 20 day EMA | 6601.86 | 6591.53 | 6584.33 | | 35 day EMA | 6565.97 | 6558.08 | 6552.08 | | 50 day EMA | 6534.13 | 6527.36 | 6521.95 |
SMA (simple moving average) of Bond 9 901NHB34_N6
| SMA period | SMA current | SMA prev | SMA prev2 | | 5 day SMA | 6668.18 | 6655.31 | 6633.71 | | 12 day SMA | 6627.5 | 6618.34 | 6608.92 | | 20 day SMA | 6589.23 | 6579.23 | 6572.23 | | 35 day SMA | 6553.48 | 6546.34 | 6541.77 | | 50 day SMA | 6527.24 | 6521.6 | 6517.54 | | 100 day SMA | 6485.88 | 6483.21 | 6480.72 | | 150 day SMA | 6440.04 | 6437.29 | 6434.75 | | 200 day SMA | 6416.98 | 6416.96 | 6417.16 |
|
|
