901 901HUDCO34_NE full analysis,charts,indicators,moving averages,SMA,DMA,EMA,ADX,MACD,RSI9 01 901HUDCO34_NE WideScreen charts, DMA,SMA,EMA technical analysis, forecast prediction, by indicators ADX,MACD,RSI,CCI NSE stock exchange
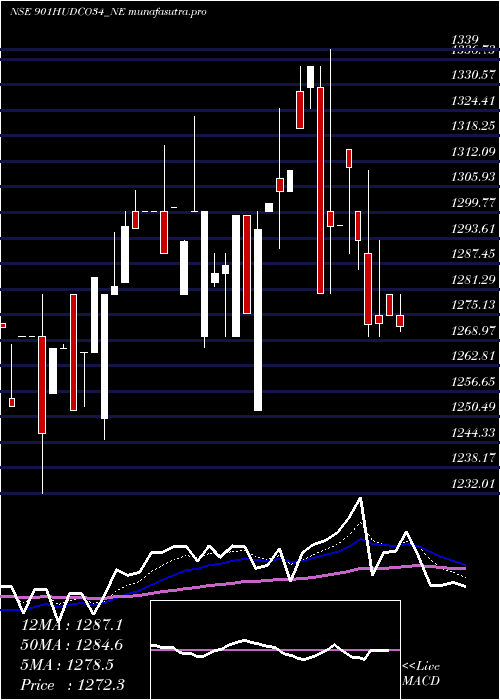
Daily price and charts and targets 901 Strong Daily Stock price targets for 901 901HUDCO34_NE are 1324.33 and 1324.84 | Daily Target 1 | 1324.21 | | Daily Target 2 | 1324.44 | | Daily Target 3 | 1324.7233333333 | | Daily Target 4 | 1324.95 | | Daily Target 5 | 1325.23 |
Daily price and volume 9 01
| Date |
Closing |
Open |
Range |
Volume |
Tue 28 October 2025 |
1324.66 (-0.03%) |
1325.01 |
1324.50 - 1325.01 |
0.4328 times |
Mon 27 October 2025 |
1325.00 (-0.3%) |
1320.02 |
1320.02 - 1325.00 |
0.4993 times |
Fri 24 October 2025 |
1329.00 (-0.08%) |
1329.00 |
1329.00 - 1329.00 |
0.0333 times |
Thu 23 October 2025 |
1330.00 (-0.23%) |
1333.00 |
1330.00 - 1334.00 |
1.984 times |
Tue 21 October 2025 |
1333.00 (0%) |
1333.00 |
1333.00 - 1333.00 |
0.1332 times |
Mon 20 October 2025 |
1333.00 (-0.15%) |
1319.00 |
1318.00 - 1335.00 |
1.3182 times |
Fri 17 October 2025 |
1335.00 (0.15%) |
1335.00 |
1335.00 - 1335.00 |
0.0333 times |
Wed 15 October 2025 |
1333.00 (0.6%) |
1333.00 |
1333.00 - 1333.00 |
0.8322 times |
Tue 14 October 2025 |
1325.01 (-0.94%) |
1341.00 |
1320.00 - 1341.00 |
0.4061 times |
Mon 13 October 2025 |
1337.58 (0.58%) |
1330.00 |
1330.00 - 1339.99 |
4.3276 times |
Fri 10 October 2025 |
1329.83 (0.67%) |
1321.50 |
1321.50 - 1330.00 |
5.1931 times |
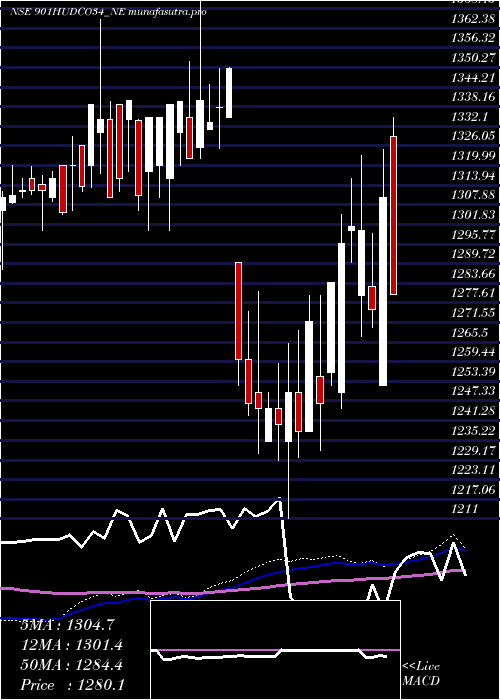
Weekly price and charts 901 Strong weekly Stock price targets for 901 901HUDCO34_NE are 1322.34 and 1327.33 | Weekly Target 1 | 1318.24 | | Weekly Target 2 | 1321.45 | | Weekly Target 3 | 1323.23 | | Weekly Target 4 | 1326.44 | | Weekly Target 5 | 1328.22 |
Weekly price and volumes for 9 01
| Date |
Closing |
Open |
Range |
Volume |
Tue 28 October 2025 |
1324.66 (-0.33%) |
1320.02 |
1320.02 - 1325.01 |
0.0941 times |
Fri 24 October 2025 |
1329.00 (-0.45%) |
1319.00 |
1318.00 - 1335.00 |
0.35 times |
Fri 17 October 2025 |
1335.00 (0.39%) |
1330.00 |
1320.00 - 1341.00 |
0.565 times |
Fri 10 October 2025 |
1329.83 (1.66%) |
1314.00 |
1310.00 - 1339.00 |
1.8979 times |
Fri 03 October 2025 |
1308.15 (-0.52%) |
1309.90 |
1296.01 - 1320.00 |
2.219 times |
Fri 26 September 2025 |
1315.00 (-1.87%) |
1301.00 |
1300.10 - 1315.00 |
0.3856 times |
Fri 19 September 2025 |
1340.00 (1.52%) |
1320.00 |
1300.05 - 1340.00 |
0.7121 times |
Fri 12 September 2025 |
1320.00 (1.15%) |
1320.00 |
1281.11 - 1320.00 |
2.4044 times |
Fri 05 September 2025 |
1305.00 (0.01%) |
1303.00 |
1290.00 - 1329.00 |
0.5912 times |
Fri 29 August 2025 |
1304.90 (-0.08%) |
1310.00 |
1288.00 - 1318.00 |
0.7807 times |
Fri 22 August 2025 |
1305.93 (1.59%) |
1290.00 |
1290.00 - 1335.00 |
3.7461 times |
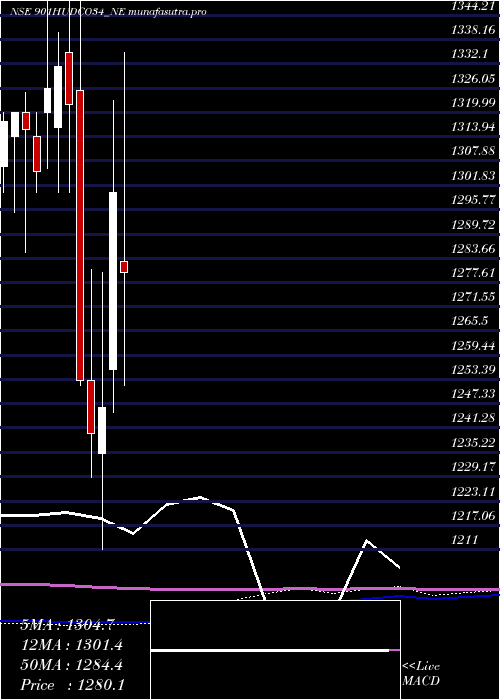
Monthly price and charts 901 Strong monthly Stock price targets for 901 901HUDCO34_NE are 1312.33 and 1353.33 | Monthly Target 1 | 1280.89 | | Monthly Target 2 | 1302.77 | | Monthly Target 3 | 1321.8866666667 | | Monthly Target 4 | 1343.77 | | Monthly Target 5 | 1362.89 |
Monthly price and volumes 9 01
| Date |
Closing |
Open |
Range |
Volume |
Tue 28 October 2025 |
1324.66 (2.21%) |
1300.01 |
1300.00 - 1341.00 |
0.5409 times |
Tue 30 September 2025 |
1296.01 (-0.68%) |
1303.00 |
1281.11 - 1340.00 |
0.5465 times |
Fri 29 August 2025 |
1304.90 (-0.71%) |
1296.00 |
1263.00 - 1335.00 |
0.9791 times |
Thu 31 July 2025 |
1314.20 (1.48%) |
1295.00 |
1265.00 - 1314.99 |
0.653 times |
Mon 30 June 2025 |
1295.00 (0.63%) |
1295.00 |
1261.10 - 1309.99 |
1.3325 times |
Fri 30 May 2025 |
1286.92 (1.09%) |
1280.00 |
1256.01 - 1339.89 |
1.8921 times |
Wed 30 April 2025 |
1273.06 (-2.07%) |
1282.80 |
1252.01 - 1339.00 |
1.4937 times |
Fri 28 March 2025 |
1300.00 (4.29%) |
1256.00 |
1245.10 - 1323.00 |
0.8235 times |
Fri 28 February 2025 |
1246.47 (0.52%) |
1235.00 |
1211.00 - 1280.00 |
1.2066 times |
Fri 31 January 2025 |
1240.00 (-1.04%) |
1253.00 |
1228.99 - 1281.00 |
0.532 times |
Tue 31 December 2024 |
1253.00 (-5.23%) |
1325.50 |
1252.00 - 1397.90 |
0.487 times |
DMA SMA EMA moving averages of 9 01 901HUDCO34_NE
DMA (daily moving average) of 9 01 901HUDCO34_NE
| DMA period | DMA value | | 5 day DMA | 1328.33 | | 12 day DMA | 1329.67 | | 20 day DMA | 1322.77 | | 35 day DMA | 1317.74 | | 50 day DMA | 1313.19 | | 100 day DMA | 1302.36 | | 150 day DMA | 1297.9 | | 200 day DMA | 1287.98 | EMA (exponential moving average) of 9 01 901HUDCO34_NE
| EMA period | EMA current | EMA prev | EMA prev2 | | 5 day EMA | 1327.38 | 1328.74 | 1330.61 | | 12 day EMA | 1326.87 | 1327.27 | 1327.68 | | 20 day EMA | 1323.83 | 1323.74 | 1323.61 | | 35 day EMA | 1318.45 | 1318.08 | 1317.67 | | 50 day EMA | 1312.58 | 1312.09 | 1311.56 |
SMA (simple moving average) of 9 01 901HUDCO34_NE
| SMA period | SMA current | SMA prev | SMA prev2 | | 5 day SMA | 1328.33 | 1330 | 1332 | | 12 day SMA | 1329.67 | 1330.86 | 1330.03 | | 20 day SMA | 1322.77 | 1321.54 | 1320.3 | | 35 day SMA | 1317.74 | 1316.89 | 1316.14 | | 50 day SMA | 1313.19 | 1312.69 | 1311.99 | | 100 day SMA | 1302.36 | 1302.11 | 1301.97 | | 150 day SMA | 1297.9 | 1297.51 | 1296.99 | | 200 day SMA | 1287.98 | 1288.04 | 1288.11 |
|
|
