SecRe 897MOFSL29_N4 full analysis,charts,indicators,moving averages,SMA,DMA,EMA,ADX,MACD,RSISec Re 897MOFSL29_N4 WideScreen charts, DMA,SMA,EMA technical analysis, forecast prediction, by indicators ADX,MACD,RSI,CCI NSE stock exchange
Daily price and charts and targets SecRe Strong Daily Stock price targets for SecRe 897MOFSL29_N4 are 1017 and 1017 | Daily Target 1 | 1017 | | Daily Target 2 | 1017 | | Daily Target 3 | 1017 | | Daily Target 4 | 1017 | | Daily Target 5 | 1017 |
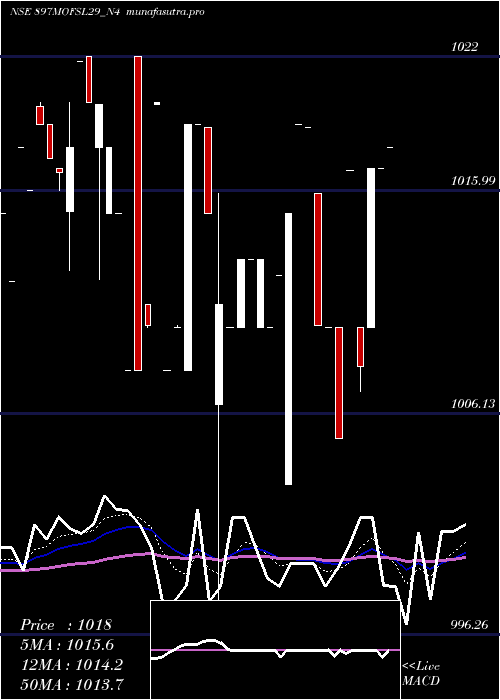
Daily price and volume Sec Re
| Date |
Closing |
Open |
Range |
Volume |
Mon 27 October 2025 |
1017.00 (0%) |
1017.00 |
1017.00 - 1017.00 |
0.3155 times |
Fri 24 October 2025 |
1017.00 (0.86%) |
1010.00 |
1010.00 - 1017.00 |
1.7981 times |
Thu 23 October 2025 |
1008.28 (-0.86%) |
1010.00 |
1007.10 - 1010.00 |
0.7098 times |
Tue 21 October 2025 |
1016.98 (1.19%) |
1016.98 |
1016.98 - 1016.98 |
1.8707 times |
Mon 20 October 2025 |
1005.00 (-0.5%) |
1010.00 |
1005.00 - 1010.00 |
1.5142 times |
Fri 17 October 2025 |
1010.00 (-0.01%) |
1010.00 |
1010.00 - 1010.00 |
0.2366 times |
Thu 16 October 2025 |
1010.10 (-0.86%) |
1015.90 |
1010.10 - 1015.90 |
2.2397 times |
Tue 14 October 2025 |
1018.90 (-0.01%) |
1018.90 |
1018.90 - 1018.90 |
0.0631 times |
Fri 10 October 2025 |
1018.99 (0.39%) |
1018.99 |
1018.99 - 1018.99 |
0.6183 times |
Thu 09 October 2025 |
1015.00 (0.27%) |
1003.00 |
1003.00 - 1015.00 |
0.6341 times |
Tue 07 October 2025 |
1012.30 (0.23%) |
1012.30 |
1012.30 - 1012.30 |
0.1577 times |
Weekly price and charts SecRe Strong weekly Stock price targets for SecRe 897MOFSL29_N4 are 1017 and 1017 | Weekly Target 1 | 1017 | | Weekly Target 2 | 1017 | | Weekly Target 3 | 1017 | | Weekly Target 4 | 1017 | | Weekly Target 5 | 1017 |
Weekly price and volumes for Sec Re
| Date |
Closing |
Open |
Range |
Volume |
Mon 27 October 2025 |
1017.00 (0%) |
1017.00 |
1017.00 - 1017.00 |
0.1189 times |
Fri 24 October 2025 |
1017.00 (0.69%) |
1010.00 |
1005.00 - 1017.00 |
2.2209 times |
Fri 17 October 2025 |
1010.00 (-0.88%) |
1018.90 |
1010.00 - 1018.90 |
0.9571 times |
Fri 10 October 2025 |
1018.99 (0.89%) |
1012.30 |
1003.00 - 1018.99 |
0.5314 times |
Fri 03 October 2025 |
1010.00 (-0.3%) |
1010.00 |
1010.00 - 1010.00 |
0.0832 times |
Fri 26 September 2025 |
1013.00 (0.3%) |
1010.00 |
1010.00 - 1013.00 |
0.6729 times |
Fri 19 September 2025 |
1010.00 (-0.88%) |
1018.90 |
986.40 - 1018.90 |
3.5382 times |
Fri 12 September 2025 |
1019.00 (1.09%) |
1010.00 |
1008.00 - 1019.00 |
0.7538 times |
Fri 05 September 2025 |
1008.00 (0%) |
1011.00 |
1008.00 - 1020.00 |
0.6242 times |
Thu 28 August 2025 |
1008.00 (-0.69%) |
1008.00 |
1008.00 - 1022.00 |
0.4993 times |
Wed 20 August 2025 |
1015.00 (-0.48%) |
1015.00 |
1015.00 - 1018.00 |
0.1189 times |

Monthly price and charts SecRe Strong monthly Stock price targets for SecRe 897MOFSL29_N4 are 1010 and 1025.99 | Monthly Target 1 | 997.01 | | Monthly Target 2 | 1007 | | Monthly Target 3 | 1012.9966666667 | | Monthly Target 4 | 1022.99 | | Monthly Target 5 | 1028.99 |
Monthly price and volumes Sec Re
| Date |
Closing |
Open |
Range |
Volume |
Mon 27 October 2025 |
1017.00 (0.39%) |
1010.00 |
1003.00 - 1018.99 |
1.226 times |
Fri 26 September 2025 |
1013.00 (0.5%) |
1011.00 |
986.40 - 1020.00 |
1.7518 times |
Thu 28 August 2025 |
1008.00 (-0.4%) |
1018.00 |
1008.00 - 1022.00 |
1.1853 times |
Thu 31 July 2025 |
1012.00 (-0.68%) |
1018.50 |
1000.00 - 1018.50 |
1.5856 times |
Mon 30 June 2025 |
1018.90 (0.88%) |
1018.00 |
1000.00 - 1020.99 |
1.6075 times |
Fri 30 May 2025 |
1010.00 (-0.79%) |
1013.00 |
1008.00 - 1022.00 |
0.6439 times |
Tue 15 April 2025 |
1018.00 (0.74%) |
1010.50 |
1010.50 - 1020.00 |
0.1502 times |
Thu 20 March 2025 |
1010.52 (0.05%) |
912.00 |
912.00 - 1020.00 |
0.262 times |
Thu 27 February 2025 |
1010.00 (0.5%) |
1004.50 |
1004.00 - 1016.00 |
0.2269 times |
Thu 30 January 2025 |
1005.00 (-0.3%) |
1008.00 |
1004.00 - 1012.00 |
1.3609 times |
Tue 31 December 2024 |
1008.00 (-0%) |
1008.00 |
1000.01 - 1013.95 |
3.3518 times |

DMA SMA EMA moving averages of Sec Re 897MOFSL29_N4
DMA (daily moving average) of Sec Re 897MOFSL29_N4
| DMA period | DMA value | | 5 day DMA | 1012.85 | | 12 day DMA | 1013.3 | | 20 day DMA | 1013.63 | | 35 day DMA | 1014.36 | | 50 day DMA | 1013.97 | | 100 day DMA | 1012.45 | | 150 day DMA | 1010.37 | | 200 day DMA | 1009.96 | EMA (exponential moving average) of Sec Re 897MOFSL29_N4
| EMA period | EMA current | EMA prev | EMA prev2 | | 5 day EMA | 1014.37 | 1013.05 | 1011.07 | | 12 day EMA | 1013.54 | 1012.91 | 1012.17 | | 20 day EMA | 1013.52 | 1013.15 | 1012.74 | | 35 day EMA | 1013.62 | 1013.42 | 1013.21 | | 50 day EMA | 1013.75 | 1013.62 | 1013.48 |
SMA (simple moving average) of Sec Re 897MOFSL29_N4
| SMA period | SMA current | SMA prev | SMA prev2 | | 5 day SMA | 1012.85 | 1011.45 | 1010.07 | | 12 day SMA | 1013.3 | 1012.96 | 1012.63 | | 20 day SMA | 1013.63 | 1013.28 | 1012.83 | | 35 day SMA | 1014.36 | 1014.33 | 1014.36 | | 50 day SMA | 1013.97 | 1013.93 | 1013.89 | | 100 day SMA | 1012.45 | 1012.33 | 1012.18 | | 150 day SMA | 1010.37 | 1010.29 | 1010.17 | | 200 day SMA | 1009.96 | 1009.88 | 1009.82 |
|
|
