GoiLoan 897GS2030_GS full analysis,charts,indicators,moving averages,SMA,DMA,EMA,ADX,MACD,RSIGoi Loan 897GS2030_GS WideScreen charts, DMA,SMA,EMA technical analysis, forecast prediction, by indicators ADX,MACD,RSI,CCI NSE stock exchange
Daily price and charts and targets GoiLoan Strong Daily Stock price targets for GoiLoan 897GS2030_GS are 111.68 and 111.73 | Daily Target 1 | 111.67 | | Daily Target 2 | 111.68 | | Daily Target 3 | 111.71666666667 | | Daily Target 4 | 111.73 | | Daily Target 5 | 111.77 |
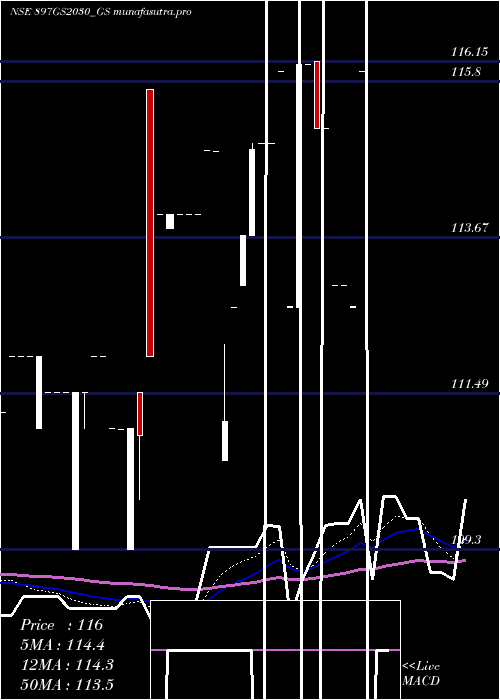
Daily price and volume Goi Loan
| Date |
Closing |
Open |
Range |
Volume |
Tue 09 December 2025 |
111.70 (0.18%) |
111.75 |
111.70 - 111.75 |
0.553 times |
Mon 08 December 2025 |
111.50 (-0.27%) |
111.00 |
111.00 - 111.50 |
0.3371 times |
Fri 05 December 2025 |
111.80 (0.04%) |
111.75 |
111.75 - 111.80 |
0.6263 times |
Thu 04 December 2025 |
111.75 (-1.97%) |
112.00 |
111.75 - 112.00 |
0.4557 times |
Thu 20 November 2025 |
114.00 (-0.78%) |
114.00 |
114.00 - 114.00 |
0.0569 times |
Wed 19 November 2025 |
114.90 (1%) |
114.90 |
114.90 - 114.90 |
2.2774 times |
Wed 12 November 2025 |
113.76 (0.9%) |
113.85 |
113.76 - 113.85 |
0.683 times |
Tue 11 November 2025 |
112.75 (-0.22%) |
113.90 |
112.75 - 113.90 |
2.0499 times |
Thu 06 November 2025 |
113.00 (0%) |
111.85 |
111.85 - 113.00 |
2.5052 times |
Thu 23 October 2025 |
113.00 (0%) |
113.00 |
113.00 - 113.00 |
0.4555 times |
Fri 17 October 2025 |
113.00 (1.79%) |
113.01 |
113.00 - 113.01 |
0.5054 times |
Weekly price and charts GoiLoan Strong weekly Stock price targets for GoiLoan 897GS2030_GS are 111.35 and 112.1 | Weekly Target 1 | 110.73 | | Weekly Target 2 | 111.22 | | Weekly Target 3 | 111.48333333333 | | Weekly Target 4 | 111.97 | | Weekly Target 5 | 112.23 |
Weekly price and volumes for Goi Loan
| Date |
Closing |
Open |
Range |
Volume |
Tue 09 December 2025 |
111.70 (-0.09%) |
111.00 |
111.00 - 111.75 |
0.0372 times |
Fri 05 December 2025 |
111.80 (-1.93%) |
112.00 |
111.75 - 112.00 |
0.0452 times |
Thu 20 November 2025 |
114.00 (0.21%) |
114.90 |
114.00 - 114.90 |
0.0976 times |
Wed 12 November 2025 |
113.76 (0.67%) |
113.90 |
112.75 - 113.90 |
0.1142 times |
Thu 06 November 2025 |
113.00 (0%) |
111.85 |
111.85 - 113.00 |
0.1047 times |
Thu 23 October 2025 |
113.00 (0%) |
113.00 |
113.00 - 113.00 |
0.019 times |
Fri 17 October 2025 |
113.00 (0%) |
111.00 |
111.00 - 113.01 |
0.0214 times |
Thu 28 August 2025 |
113.00 (-0.66%) |
113.00 |
113.00 - 113.00 |
0.0066 times |
Fri 22 August 2025 |
113.75 (0.66%) |
110.01 |
110.01 - 113.75 |
9.5388 times |
Fri 08 August 2025 |
113.00 (-1.31%) |
112.90 |
112.90 - 113.00 |
0.0151 times |
Fri 25 July 2025 |
114.50 (1.33%) |
114.15 |
114.15 - 114.50 |
0.002 times |

Monthly price and charts GoiLoan Strong monthly Stock price targets for GoiLoan 897GS2030_GS are 110.85 and 111.85 | Monthly Target 1 | 110.57 | | Monthly Target 2 | 111.13 | | Monthly Target 3 | 111.56666666667 | | Monthly Target 4 | 112.13 | | Monthly Target 5 | 112.57 |
Monthly price and volumes Goi Loan
| Date |
Closing |
Open |
Range |
Volume |
Tue 09 December 2025 |
111.70 (-2.02%) |
112.00 |
111.00 - 112.00 |
0.0747 times |
Thu 20 November 2025 |
114.00 (0.88%) |
111.85 |
111.85 - 114.90 |
0.2869 times |
Thu 23 October 2025 |
113.00 (1.79%) |
113.01 |
113.00 - 113.01 |
0.0364 times |
Wed 10 September 2025 |
111.01 (-1.76%) |
111.00 |
111.00 - 111.01 |
0.0003 times |
Thu 28 August 2025 |
113.00 (0.09%) |
113.00 |
110.01 - 113.75 |
8.6542 times |
Wed 30 July 2025 |
112.90 (-0.96%) |
113.60 |
112.90 - 114.50 |
0.0546 times |
Mon 30 June 2025 |
113.99 (-1.73%) |
114.50 |
113.99 - 114.50 |
0.0136 times |
Fri 23 May 2025 |
116.00 (2.93%) |
112.69 |
112.69 - 116.15 |
0.028 times |
Wed 30 April 2025 |
112.70 (-1.14%) |
114.90 |
110.55 - 116.00 |
0.1403 times |
Fri 28 March 2025 |
114.00 (2.72%) |
109.30 |
109.30 - 115.75 |
0.7111 times |
Fri 28 February 2025 |
110.98 (-0.47%) |
109.30 |
109.30 - 112.00 |
0.067 times |

DMA SMA EMA moving averages of Goi Loan 897GS2030_GS
DMA (daily moving average) of Goi Loan 897GS2030_GS
| DMA period | DMA value | | 5 day DMA | 112.15 | | 12 day DMA | 112.68 | | 20 day DMA | 112.65 | | 35 day DMA | 113.33 | | 50 day DMA | 113.54 | | 100 day DMA | 113.12 | | 150 day DMA | 112.8 | | 200 day DMA | 113.45 | EMA (exponential moving average) of Goi Loan 897GS2030_GS
| EMA period | EMA current | EMA prev | EMA prev2 | | 5 day EMA | 112.09 | 112.28 | 112.67 | | 12 day EMA | 112.54 | 112.69 | 112.91 | | 20 day EMA | 112.77 | 112.88 | 113.02 | | 35 day EMA | 112.96 | 113.03 | 113.12 | | 50 day EMA | 113.2 | 113.26 | 113.33 |
SMA (simple moving average) of Goi Loan 897GS2030_GS
| SMA period | SMA current | SMA prev | SMA prev2 | | 5 day SMA | 112.15 | 112.79 | 113.24 | | 12 day SMA | 112.68 | 112.79 | 112.98 | | 20 day SMA | 112.65 | 112.77 | 112.85 | | 35 day SMA | 113.33 | 113.45 | 113.55 | | 50 day SMA | 113.54 | 113.52 | 113.51 | | 100 day SMA | 113.12 | 113.14 | 113.16 | | 150 day SMA | 112.8 | 112.79 | 112.79 | | 200 day SMA | 113.45 | 113.46 | 113.46 |
|
|
