Nhb8 893NHB29_N6 full analysis,charts,indicators,moving averages,SMA,DMA,EMA,ADX,MACD,RSINhb 8 893NHB29_N6 WideScreen charts, DMA,SMA,EMA technical analysis, forecast prediction, by indicators ADX,MACD,RSI,CCI NSE stock exchange
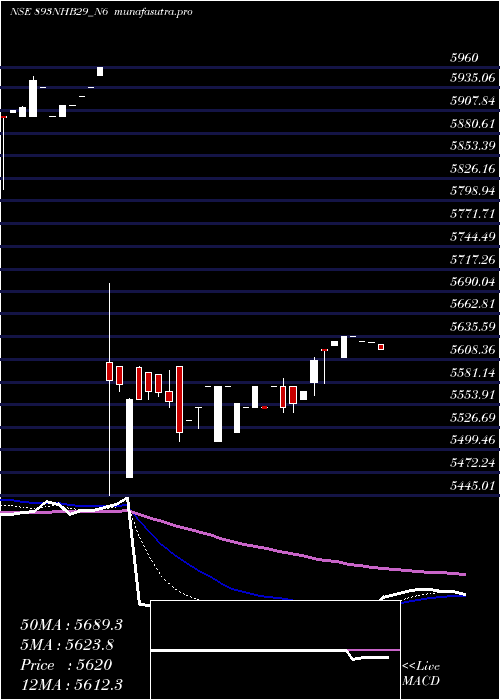
Daily price and charts and targets Nhb8 Strong Daily Stock price targets for Nhb8 893NHB29_N6 are 5830 and 5830 | Daily Target 1 | 5830 | | Daily Target 2 | 5830 | | Daily Target 3 | 5830 | | Daily Target 4 | 5830 | | Daily Target 5 | 5830 |
Daily price and volume Nhb 8
| Date |
Closing |
Open |
Range |
Volume |
Tue 09 December 2025 |
5830.00 (-0.09%) |
5830.00 |
5830.00 - 5830.00 |
0.0171 times |
Fri 05 December 2025 |
5835.35 (-0.51%) |
5849.00 |
5825.00 - 5849.00 |
1.4505 times |
Fri 21 November 2025 |
5865.00 (1.12%) |
5860.00 |
5860.00 - 5865.00 |
1.5188 times |
Fri 14 November 2025 |
5800.00 (0.57%) |
5840.00 |
5800.00 - 5840.00 |
1.3652 times |
Thu 13 November 2025 |
5767.00 (0.03%) |
5767.00 |
5767.00 - 5767.00 |
0.4266 times |
Mon 10 November 2025 |
5765.00 (0.09%) |
5765.00 |
5765.00 - 5765.00 |
0.9727 times |
Mon 03 November 2025 |
5760.00 (0.11%) |
5760.00 |
5760.00 - 5760.00 |
1.9625 times |
Fri 31 October 2025 |
5753.57 (-0.11%) |
5760.00 |
5740.10 - 5760.00 |
0.5631 times |
Thu 30 October 2025 |
5760.00 (0.17%) |
5760.00 |
5760.00 - 5760.00 |
1.7065 times |
Tue 28 October 2025 |
5750.01 (-1.03%) |
5750.01 |
5750.01 - 5750.01 |
0.0171 times |
Thu 23 October 2025 |
5810.00 (0.53%) |
5810.00 |
5810.00 - 5810.00 |
0.3242 times |
Weekly price and charts Nhb8 Strong weekly Stock price targets for Nhb8 893NHB29_N6 are 5830 and 5830 | Weekly Target 1 | 5830 | | Weekly Target 2 | 5830 | | Weekly Target 3 | 5830 | | Weekly Target 4 | 5830 | | Weekly Target 5 | 5830 |
Weekly price and volumes for Nhb 8
| Date |
Closing |
Open |
Range |
Volume |
Tue 09 December 2025 |
5830.00 (-0.09%) |
5830.00 |
5830.00 - 5830.00 |
0.0064 times |
Fri 05 December 2025 |
5835.35 (-0.51%) |
5849.00 |
5825.00 - 5849.00 |
0.5435 times |
Fri 21 November 2025 |
5865.00 (1.12%) |
5860.00 |
5860.00 - 5865.00 |
0.5691 times |
Fri 14 November 2025 |
5800.00 (0.69%) |
5765.00 |
5765.00 - 5840.00 |
1.0358 times |
Mon 03 November 2025 |
5760.00 (0.11%) |
5760.00 |
5760.00 - 5760.00 |
0.7353 times |
Fri 31 October 2025 |
5753.57 (-0.97%) |
5750.01 |
5740.10 - 5760.00 |
0.8568 times |
Thu 23 October 2025 |
5810.00 (0.83%) |
5750.10 |
5750.10 - 5810.00 |
1.5473 times |
Fri 17 October 2025 |
5761.90 (0.73%) |
5682.00 |
5667.10 - 5799.00 |
1.3043 times |
Fri 26 September 2025 |
5720.00 (-0.35%) |
5750.00 |
5720.00 - 5750.00 |
1.5921 times |
Fri 12 September 2025 |
5740.00 (0%) |
5740.00 |
5740.00 - 5747.00 |
1.8095 times |
Fri 05 September 2025 |
5740.00 (0%) |
5735.00 |
5735.00 - 5795.00 |
2.1036 times |
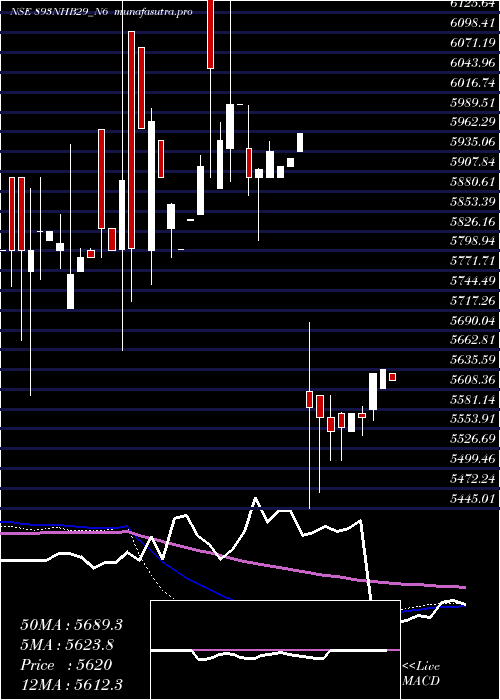
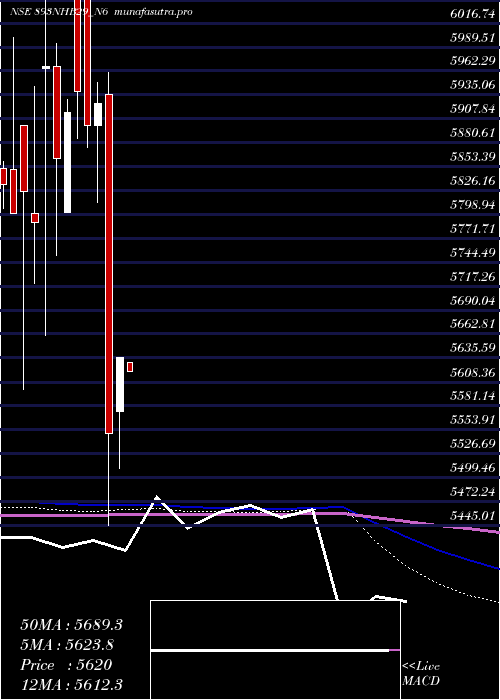
Monthly price and charts Nhb8 Strong monthly Stock price targets for Nhb8 893NHB29_N6 are 5815.5 and 5839.5 | Monthly Target 1 | 5810.67 | | Monthly Target 2 | 5820.33 | | Monthly Target 3 | 5834.6666666667 | | Monthly Target 4 | 5844.33 | | Monthly Target 5 | 5858.67 |
Monthly price and volumes Nhb 8
| Date |
Closing |
Open |
Range |
Volume |
Tue 09 December 2025 |
5830.00 (-0.6%) |
5849.00 |
5825.00 - 5849.00 |
0.0682 times |
Fri 21 November 2025 |
5865.00 (1.94%) |
5760.00 |
5760.00 - 5865.00 |
0.2901 times |
Fri 31 October 2025 |
5753.57 (0.59%) |
5682.00 |
5667.10 - 5810.00 |
0.4597 times |
Fri 26 September 2025 |
5720.00 (-0.35%) |
5735.00 |
5720.00 - 5795.00 |
0.6824 times |
Fri 22 August 2025 |
5740.00 (0.76%) |
5696.91 |
5609.61 - 5999.00 |
2.3807 times |
Thu 31 July 2025 |
5696.91 (1.1%) |
5635.25 |
5602.05 - 5700.00 |
1.5938 times |
Mon 30 June 2025 |
5635.00 (-0.03%) |
5650.00 |
5600.00 - 5700.00 |
0.6602 times |
Fri 30 May 2025 |
5636.62 (0.01%) |
5630.00 |
5600.05 - 5999.96 |
0.821 times |
Wed 30 April 2025 |
5635.82 (1.55%) |
5575.00 |
5510.00 - 5635.94 |
1.6167 times |
Fri 28 March 2025 |
5550.00 (-6.33%) |
5935.00 |
5445.01 - 5960.00 |
1.4273 times |
Fri 28 February 2025 |
5925.00 (0.42%) |
5900.00 |
5812.59 - 5949.00 |
1.3544 times |
DMA SMA EMA moving averages of Nhb 8 893NHB29_N6
DMA (daily moving average) of Nhb 8 893NHB29_N6
| DMA period | DMA value | | 5 day DMA | 5819.47 | | 12 day DMA | 5789.6 | | 20 day DMA | 5767.63 | | 35 day DMA | 5750.86 | | 50 day DMA | 5722.67 | | 100 day DMA | 5673.54 | | 150 day DMA | 5733.25 | | 200 day DMA | 5756.86 | EMA (exponential moving average) of Nhb 8 893NHB29_N6
| EMA period | EMA current | EMA prev | EMA prev2 | | 5 day EMA | 5820.2 | 5815.3 | 5805.28 | | 12 day EMA | 5794.3 | 5787.81 | 5779.17 | | 20 day EMA | 5776.26 | 5770.61 | 5763.8 | | 35 day EMA | 5748.67 | 5743.88 | 5738.49 | | 50 day EMA | 5726.27 | 5722.04 | 5717.42 |
SMA (simple moving average) of Nhb 8 893NHB29_N6
| SMA period | SMA current | SMA prev | SMA prev2 | | 5 day SMA | 5819.47 | 5806.47 | 5791.4 | | 12 day SMA | 5789.6 | 5783.92 | 5771.43 | | 20 day SMA | 5767.63 | 5763.13 | 5758.36 | | 35 day SMA | 5750.86 | 5747.01 | 5743.02 | | 50 day SMA | 5722.67 | 5718.78 | 5715.08 | | 100 day SMA | 5673.54 | 5670.74 | 5667.74 | | 150 day SMA | 5733.25 | 5734.35 | 5735.22 | | 200 day SMA | 5756.86 | 5756.89 | 5756.91 |
|
|
