891 891NTPC33_N6 full analysis,charts,indicators,moving averages,SMA,DMA,EMA,ADX,MACD,RSI8 91 891NTPC33_N6 WideScreen charts, DMA,SMA,EMA technical analysis, forecast prediction, by indicators ADX,MACD,RSI,CCI NSE stock exchange
Daily price and charts and targets 891 Strong Daily Stock price targets for 891 891NTPC33_N6 are 1312.75 and 1318.25 | Daily Target 1 | 1311.83 | | Daily Target 2 | 1313.67 | | Daily Target 3 | 1317.3333333333 | | Daily Target 4 | 1319.17 | | Daily Target 5 | 1322.83 |
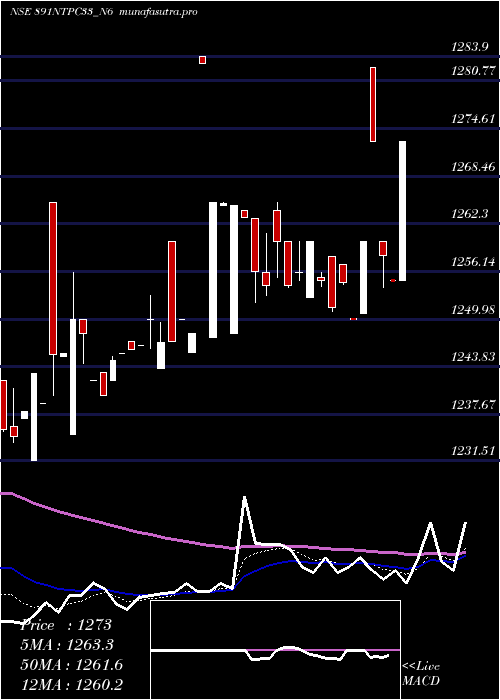
Daily price and volume 8 91
| Date |
Closing |
Open |
Range |
Volume |
Tue 28 October 2025 |
1315.50 (-0.34%) |
1320.01 |
1315.50 - 1321.00 |
0.3971 times |
Mon 27 October 2025 |
1320.00 (0%) |
1320.00 |
1320.00 - 1320.00 |
0.204 times |
Fri 24 October 2025 |
1320.00 (0.8%) |
1320.00 |
1320.00 - 1320.00 |
0.0109 times |
Thu 23 October 2025 |
1309.58 (-1.54%) |
1307.92 |
1307.92 - 1320.00 |
0.4517 times |
Fri 17 October 2025 |
1330.00 (0%) |
1330.00 |
1330.00 - 1330.00 |
0.0328 times |
Thu 16 October 2025 |
1330.00 (0.15%) |
1330.00 |
1330.00 - 1330.00 |
0.7359 times |
Wed 15 October 2025 |
1328.00 (0.23%) |
1320.00 |
1320.00 - 1328.00 |
1.3406 times |
Mon 13 October 2025 |
1324.90 (-0.23%) |
1286.00 |
1282.20 - 1330.00 |
2.2587 times |
Fri 10 October 2025 |
1327.98 (1.06%) |
1315.00 |
1315.00 - 1328.00 |
1.8761 times |
Thu 09 October 2025 |
1314.00 (0%) |
1314.00 |
1307.50 - 1314.00 |
2.6922 times |
Wed 08 October 2025 |
1314.00 (0%) |
1285.10 |
1285.00 - 1314.00 |
5.0638 times |
Weekly price and charts 891 Strong weekly Stock price targets for 891 891NTPC33_N6 are 1312.75 and 1318.25 | Weekly Target 1 | 1311.83 | | Weekly Target 2 | 1313.67 | | Weekly Target 3 | 1317.3333333333 | | Weekly Target 4 | 1319.17 | | Weekly Target 5 | 1322.83 |
Weekly price and volumes for 8 91
| Date |
Closing |
Open |
Range |
Volume |
Tue 28 October 2025 |
1315.50 (-0.34%) |
1320.00 |
1315.50 - 1321.00 |
0.0844 times |
Fri 24 October 2025 |
1320.00 (-0.75%) |
1307.92 |
1307.92 - 1320.00 |
0.065 times |
Fri 17 October 2025 |
1330.00 (0.15%) |
1286.00 |
1282.20 - 1330.00 |
0.6133 times |
Fri 10 October 2025 |
1327.98 (1.05%) |
1314.15 |
1285.00 - 1328.00 |
1.6528 times |
Fri 03 October 2025 |
1314.15 (1.01%) |
1301.00 |
1290.00 - 1324.90 |
1.818 times |
Thu 25 September 2025 |
1301.00 (-1.29%) |
1305.00 |
1297.50 - 1318.00 |
1.3755 times |
Fri 19 September 2025 |
1318.00 (1.78%) |
1310.00 |
1297.52 - 1318.00 |
2.3127 times |
Fri 12 September 2025 |
1295.00 (1.09%) |
1292.00 |
1280.10 - 1318.00 |
1.7617 times |
Wed 03 September 2025 |
1281.00 (-0.31%) |
1284.99 |
1275.61 - 1285.00 |
0.0389 times |
Fri 22 August 2025 |
1284.99 (0.08%) |
1273.50 |
1273.50 - 1285.00 |
0.2778 times |
Thu 14 August 2025 |
1283.99 (0.78%) |
1284.40 |
1283.99 - 1284.40 |
0.0645 times |

Monthly price and charts 891 Strong monthly Stock price targets for 891 891NTPC33_N6 are 1298.85 and 1346.65 | Monthly Target 1 | 1261.43 | | Monthly Target 2 | 1288.47 | | Monthly Target 3 | 1309.2333333333 | | Monthly Target 4 | 1336.27 | | Monthly Target 5 | 1357.03 |
Monthly price and volumes 8 91
| Date |
Closing |
Open |
Range |
Volume |
Tue 28 October 2025 |
1315.50 (1.35%) |
1308.00 |
1282.20 - 1330.00 |
0.813 times |
Tue 30 September 2025 |
1298.00 (1.01%) |
1275.70 |
1275.61 - 1318.00 |
1.363 times |
Tue 26 August 2025 |
1285.00 (0.78%) |
1283.90 |
1271.00 - 1285.00 |
0.2181 times |
Wed 30 July 2025 |
1275.00 (0.27%) |
1280.00 |
1265.00 - 1299.99 |
0.7291 times |
Fri 27 June 2025 |
1271.56 (-0.14%) |
1273.00 |
1265.00 - 1284.74 |
0.5669 times |
Fri 30 May 2025 |
1273.40 (0.58%) |
1275.00 |
1255.51 - 1285.00 |
0.7862 times |
Wed 30 April 2025 |
1266.00 (0.8%) |
1252.70 |
1250.00 - 1282.59 |
0.6718 times |
Fri 28 March 2025 |
1256.00 (0.48%) |
1243.51 |
1243.51 - 1283.90 |
1.2111 times |
Fri 28 February 2025 |
1250.00 (0.97%) |
1231.51 |
1231.51 - 1265.00 |
0.6544 times |
Fri 31 January 2025 |
1238.01 (-2.64%) |
1272.35 |
1234.00 - 1295.00 |
2.9864 times |
Tue 31 December 2024 |
1271.54 (-7.04%) |
1328.00 |
1259.00 - 1328.00 |
6.2704 times |

DMA SMA EMA moving averages of 8 91 891NTPC33_N6
DMA (daily moving average) of 8 91 891NTPC33_N6
| DMA period | DMA value | | 5 day DMA | 1319.02 | | 12 day DMA | 1320.66 | | 20 day DMA | 1315.81 | | 35 day DMA | 1306.5 | | 50 day DMA | 1297.75 | | 100 day DMA | 1285.33 | | 150 day DMA | 1275.11 | | 200 day DMA | 1285.54 | EMA (exponential moving average) of 8 91 891NTPC33_N6
| EMA period | EMA current | EMA prev | EMA prev2 | | 5 day EMA | 1318.81 | 1320.47 | 1320.71 | | 12 day EMA | 1318.41 | 1318.94 | 1318.75 | | 20 day EMA | 1314.96 | 1314.9 | 1314.36 | | 35 day EMA | 1307.22 | 1306.73 | 1305.95 | | 50 day EMA | 1298.68 | 1297.99 | 1297.09 |
SMA (simple moving average) of 8 91 891NTPC33_N6
| SMA period | SMA current | SMA prev | SMA prev2 | | 5 day SMA | 1319.02 | 1321.92 | 1323.52 | | 12 day SMA | 1320.66 | 1320.54 | 1320.05 | | 20 day SMA | 1315.81 | 1315.73 | 1314.64 | | 35 day SMA | 1306.5 | 1305.57 | 1304.54 | | 50 day SMA | 1297.75 | 1297.04 | 1296.34 | | 100 day SMA | 1285.33 | 1284.78 | 1284.08 | | 150 day SMA | 1275.11 | 1274.79 | 1274.48 | | 200 day SMA | 1285.54 | 1285.55 | 1285.59 |
|
|
