Bond8 871REC28_N9 full analysis,charts,indicators,moving averages,SMA,DMA,EMA,ADX,MACD,RSIBond 8 871REC28_N9 WideScreen charts, DMA,SMA,EMA technical analysis, forecast prediction, by indicators ADX,MACD,RSI,CCI NSE stock exchange
Daily price and charts and targets Bond8 Strong Daily Stock price targets for Bond8 871REC28_N9 are 1171 and 1181 | Daily Target 1 | 1162.67 | | Daily Target 2 | 1169.33 | | Daily Target 3 | 1172.6666666667 | | Daily Target 4 | 1179.33 | | Daily Target 5 | 1182.67 |
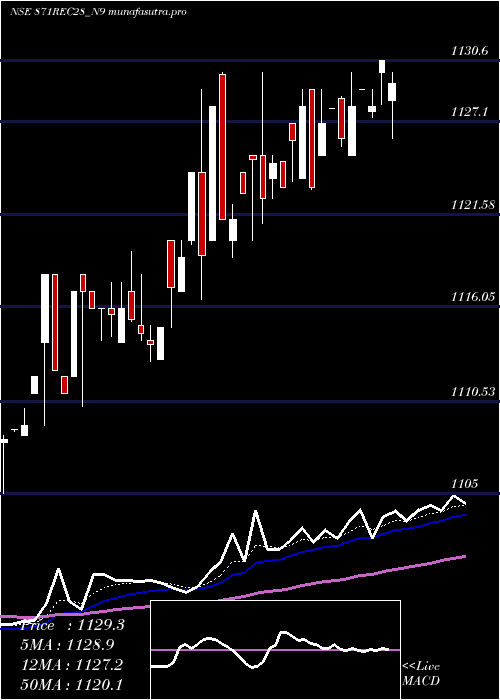
Daily price and volume Bond 8
| Date |
Closing |
Open |
Range |
Volume |
Tue 28 October 2025 |
1176.00 (0.68%) |
1166.00 |
1166.00 - 1176.00 |
1.0768 times |
Mon 27 October 2025 |
1168.10 (-0.49%) |
1167.55 |
1167.50 - 1168.10 |
0.0925 times |
Fri 24 October 2025 |
1173.86 (-0.27%) |
1177.00 |
1167.10 - 1177.00 |
1.3872 times |
Thu 23 October 2025 |
1177.00 (0.34%) |
1175.00 |
1175.00 - 1177.00 |
0.1206 times |
Mon 20 October 2025 |
1173.00 (-0.26%) |
1153.00 |
1153.00 - 1173.00 |
0.661 times |
Fri 17 October 2025 |
1176.00 (0.65%) |
1168.35 |
1168.35 - 1177.00 |
0.2372 times |
Thu 16 October 2025 |
1168.35 (-0.53%) |
1174.15 |
1168.15 - 1174.15 |
1.0173 times |
Wed 15 October 2025 |
1174.53 (0.69%) |
1168.90 |
1168.90 - 1175.00 |
3.3052 times |
Tue 14 October 2025 |
1166.44 (-0.05%) |
1167.07 |
1164.10 - 1168.90 |
0.3916 times |
Mon 13 October 2025 |
1167.07 (0.41%) |
1162.30 |
1160.05 - 1168.00 |
1.7105 times |
Fri 10 October 2025 |
1162.31 (0.17%) |
1162.50 |
1162.31 - 1162.55 |
0.6385 times |
Weekly price and charts Bond8 Strong weekly Stock price targets for Bond8 871REC28_N9 are 1171 and 1181 | Weekly Target 1 | 1162.67 | | Weekly Target 2 | 1169.33 | | Weekly Target 3 | 1172.6666666667 | | Weekly Target 4 | 1179.33 | | Weekly Target 5 | 1182.67 |
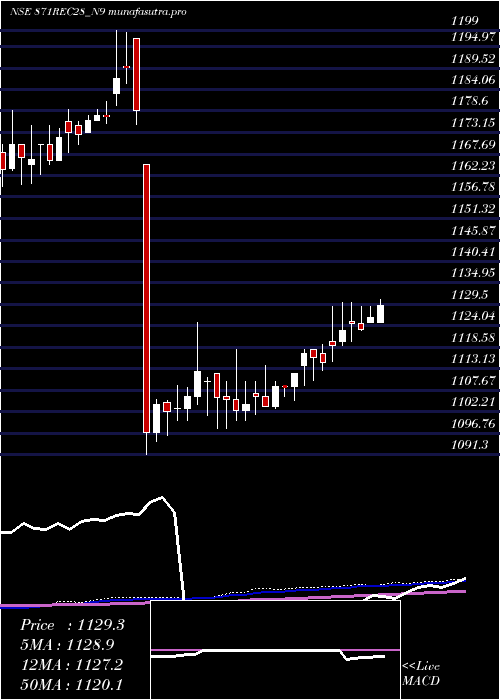
Weekly price and volumes for Bond 8
| Date |
Closing |
Open |
Range |
Volume |
Tue 28 October 2025 |
1176.00 (0.18%) |
1167.55 |
1166.00 - 1176.00 |
0.3115 times |
Fri 24 October 2025 |
1173.86 (-0.18%) |
1153.00 |
1153.00 - 1177.00 |
0.5779 times |
Fri 17 October 2025 |
1176.00 (1.18%) |
1162.30 |
1160.05 - 1177.00 |
1.7749 times |
Fri 10 October 2025 |
1162.31 (0.2%) |
1160.00 |
1155.50 - 1166.60 |
2.2456 times |
Fri 03 October 2025 |
1160.00 (0.26%) |
1157.00 |
1153.86 - 1164.89 |
0.6012 times |
Fri 26 September 2025 |
1157.00 (0.26%) |
1154.99 |
1150.00 - 1159.43 |
2.2272 times |
Fri 19 September 2025 |
1154.00 (0.35%) |
1150.00 |
1146.00 - 1154.00 |
0.4896 times |
Fri 12 September 2025 |
1150.00 (0.08%) |
1150.00 |
1147.10 - 1154.50 |
0.4763 times |
Fri 05 September 2025 |
1149.06 (-0.08%) |
1150.00 |
1145.10 - 1156.00 |
0.7585 times |
Fri 29 August 2025 |
1149.99 (0.26%) |
1153.90 |
1144.19 - 1157.80 |
0.5374 times |
Fri 22 August 2025 |
1147.00 (0%) |
1144.00 |
1143.10 - 1155.00 |
1.5984 times |
Monthly price and charts Bond8 Strong monthly Stock price targets for Bond8 871REC28_N9 are 1164.5 and 1188.5 | Monthly Target 1 | 1144.67 | | Monthly Target 2 | 1160.33 | | Monthly Target 3 | 1168.6666666667 | | Monthly Target 4 | 1184.33 | | Monthly Target 5 | 1192.67 |
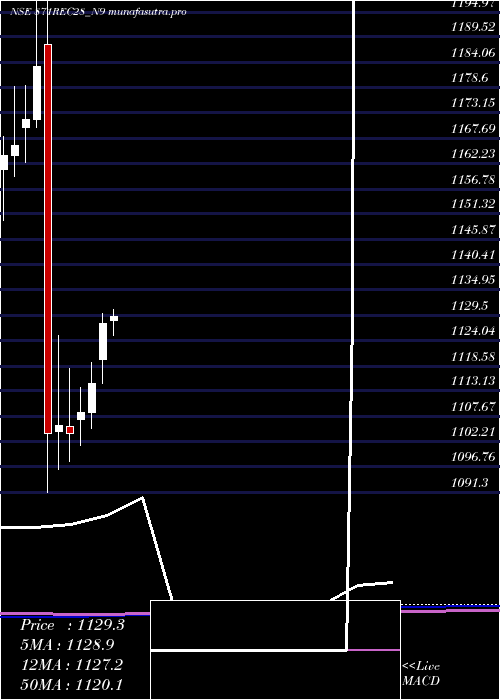
Monthly price and volumes Bond 8
| Date |
Closing |
Open |
Range |
Volume |
Tue 28 October 2025 |
1176.00 (1.9%) |
1158.90 |
1153.00 - 1177.00 |
1.0774 times |
Tue 30 September 2025 |
1154.08 (0.36%) |
1150.00 |
1145.10 - 1159.43 |
0.8649 times |
Fri 29 August 2025 |
1149.99 (1.05%) |
1138.01 |
1138.00 - 1157.80 |
1.0142 times |
Thu 31 July 2025 |
1138.00 (0.13%) |
1137.00 |
1132.01 - 1148.00 |
0.9957 times |
Mon 30 June 2025 |
1136.49 (0.04%) |
1140.00 |
1130.50 - 1144.00 |
0.5974 times |
Fri 30 May 2025 |
1136.00 (0.73%) |
1128.40 |
1125.00 - 1147.00 |
1.1594 times |
Tue 29 April 2025 |
1127.80 (1.16%) |
1119.99 |
1114.90 - 1130.00 |
1.0387 times |
Fri 28 March 2025 |
1114.86 (0.57%) |
1108.49 |
1105.00 - 1119.38 |
0.8803 times |
Fri 28 February 2025 |
1108.49 (0.41%) |
1107.00 |
1101.50 - 1113.99 |
1.1166 times |
Fri 31 January 2025 |
1104.00 (-0.14%) |
1105.50 |
1098.00 - 1118.00 |
1.2554 times |
Tue 31 December 2024 |
1105.60 (0.14%) |
1104.50 |
1096.10 - 1125.00 |
2.2373 times |
DMA SMA EMA moving averages of Bond 8 871REC28_N9
DMA (daily moving average) of Bond 8 871REC28_N9
| DMA period | DMA value | | 5 day DMA | 1173.59 | | 12 day DMA | 1170.25 | | 20 day DMA | 1165.74 | | 35 day DMA | 1159.87 | | 50 day DMA | 1156.37 | | 100 day DMA | 1147.26 | | 150 day DMA | 1139.29 | | 200 day DMA | 1130.96 | EMA (exponential moving average) of Bond 8 871REC28_N9
| EMA period | EMA current | EMA prev | EMA prev2 | | 5 day EMA | 1173.13 | 1171.69 | 1173.48 | | 12 day EMA | 1170.24 | 1169.19 | 1169.39 | | 20 day EMA | 1166.83 | 1165.87 | 1165.64 | | 35 day EMA | 1161.87 | 1161.04 | 1160.62 | | 50 day EMA | 1156.99 | 1156.21 | 1155.72 |
SMA (simple moving average) of Bond 8 871REC28_N9
| SMA period | SMA current | SMA prev | SMA prev2 | | 5 day SMA | 1173.59 | 1173.59 | 1173.64 | | 12 day SMA | 1170.25 | 1169.28 | 1168.86 | | 20 day SMA | 1165.74 | 1164.74 | 1164.08 | | 35 day SMA | 1159.87 | 1159.11 | 1158.48 | | 50 day SMA | 1156.37 | 1155.77 | 1155.26 | | 100 day SMA | 1147.26 | 1146.94 | 1146.64 | | 150 day SMA | 1139.29 | 1138.84 | 1138.44 | | 200 day SMA | 1130.96 | 1130.63 | 1130.32 |
|
|
