Serencd865 865TCAPS27_N8 full analysis,charts,indicators,moving averages,SMA,DMA,EMA,ADX,MACD,RSISerencd8 65 865TCAPS27_N8 WideScreen charts, DMA,SMA,EMA technical analysis, forecast prediction, by indicators ADX,MACD,RSI,CCI NSE stock exchange
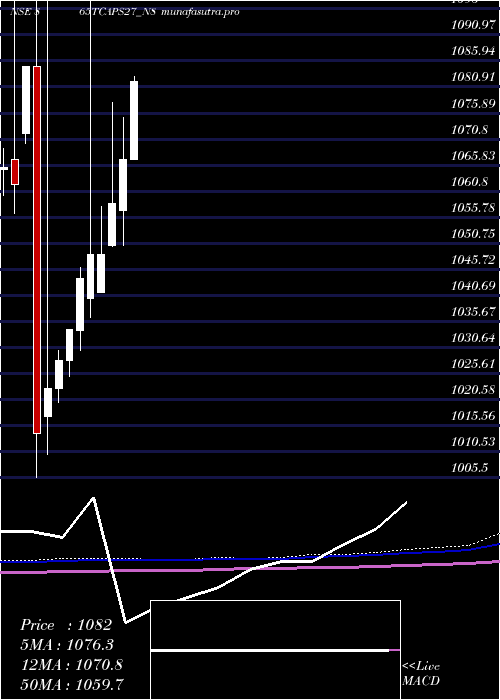
Daily price and charts and targets Serencd865 Strong Daily Stock price targets for Serencd865 865TCAPS27_N8 are 1034.75 and 1036.75 | Daily Target 1 | 1033.17 | | Daily Target 2 | 1034.33 | | Daily Target 3 | 1035.1666666667 | | Daily Target 4 | 1036.33 | | Daily Target 5 | 1037.17 |
Daily price and volume Serencd8 65
| Date |
Closing |
Open |
Range |
Volume |
Tue 28 October 2025 |
1035.50 (-0.91%) |
1035.00 |
1034.00 - 1036.00 |
1.5949 times |
Mon 27 October 2025 |
1045.00 (1.46%) |
1040.00 |
1040.00 - 1045.00 |
1.5949 times |
Fri 24 October 2025 |
1030.00 (0.85%) |
1030.00 |
1030.00 - 1030.00 |
0.0598 times |
Thu 16 October 2025 |
1021.35 (0.13%) |
1021.35 |
1021.35 - 1021.35 |
0.1635 times |
Tue 14 October 2025 |
1020.05 (-0%) |
1016.15 |
1016.10 - 1020.05 |
0.5941 times |
Mon 13 October 2025 |
1020.10 (0.01%) |
1020.10 |
1020.10 - 1020.10 |
0.1914 times |
Fri 10 October 2025 |
1020.00 (-0.49%) |
1016.25 |
1016.25 - 1029.00 |
1.3836 times |
Thu 09 October 2025 |
1025.00 (0%) |
1025.00 |
1025.00 - 1025.00 |
0.0877 times |
Wed 08 October 2025 |
1025.00 (0.49%) |
1025.00 |
1025.00 - 1025.00 |
0.004 times |
Tue 07 October 2025 |
1020.00 (0%) |
1016.00 |
1016.00 - 1021.95 |
4.3262 times |
Mon 06 October 2025 |
1020.00 (0.13%) |
1021.00 |
1020.00 - 1022.00 |
0.9928 times |
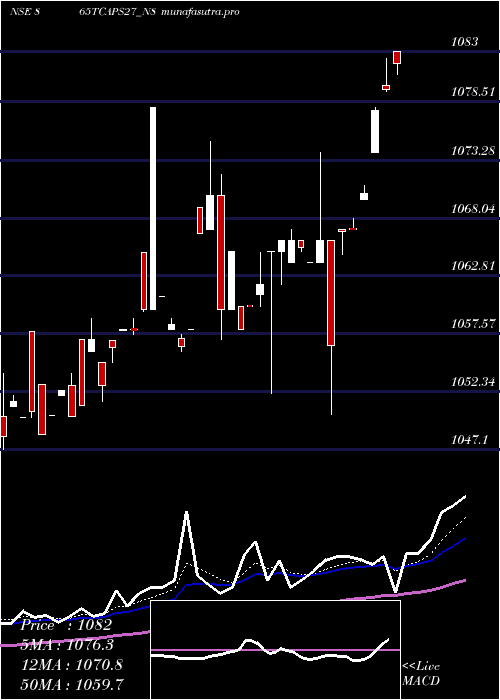
Weekly price and charts Serencd865 Strong weekly Stock price targets for Serencd865 865TCAPS27_N8 are 1029.25 and 1040.25 | Weekly Target 1 | 1027.17 | | Weekly Target 2 | 1031.33 | | Weekly Target 3 | 1038.1666666667 | | Weekly Target 4 | 1042.33 | | Weekly Target 5 | 1049.17 |
Weekly price and volumes for Serencd8 65
| Date |
Closing |
Open |
Range |
Volume |
Tue 28 October 2025 |
1035.50 (0.53%) |
1040.00 |
1034.00 - 1045.00 |
0.5715 times |
Fri 24 October 2025 |
1030.00 (0.98%) |
1020.10 |
1016.10 - 1030.00 |
0.1807 times |
Fri 10 October 2025 |
1020.00 (0.13%) |
1021.00 |
1016.00 - 1029.00 |
1.2172 times |
Wed 01 October 2025 |
1018.66 (-0.52%) |
1049.00 |
1016.30 - 1049.00 |
0.2522 times |
Thu 25 September 2025 |
1024.00 (-0.58%) |
1026.00 |
1024.00 - 1026.00 |
0.47 times |
Fri 19 September 2025 |
1029.98 (1.38%) |
1016.00 |
1015.00 - 1029.99 |
0.7551 times |
Fri 12 September 2025 |
1016.00 (0.07%) |
1016.20 |
1016.00 - 1021.99 |
0.1672 times |
Fri 05 September 2025 |
1015.25 (-1.43%) |
1025.00 |
1015.25 - 1025.20 |
0.9551 times |
Fri 29 August 2025 |
1030.00 (0.49%) |
1029.84 |
1020.00 - 1030.00 |
1.2908 times |
Wed 20 August 2025 |
1025.00 (0.7%) |
1018.00 |
1018.00 - 1029.89 |
4.1403 times |
Thu 14 August 2025 |
1017.84 (-7.3%) |
1026.00 |
1012.00 - 1035.00 |
0.3372 times |
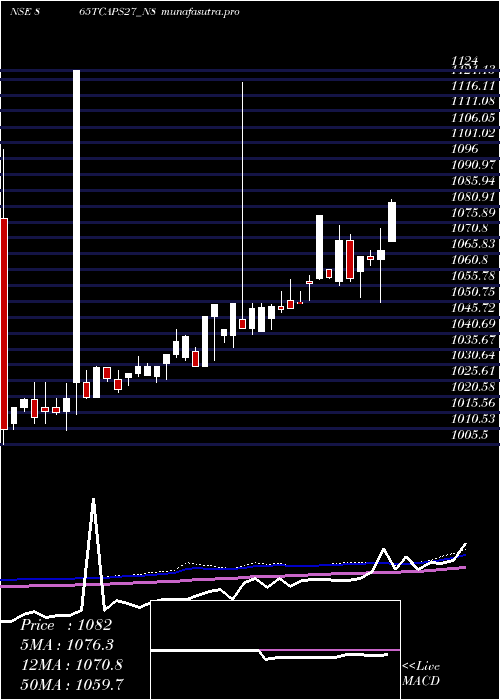
Monthly price and charts Serencd865 Strong monthly Stock price targets for Serencd865 865TCAPS27_N8 are 1025.75 and 1054.75 | Monthly Target 1 | 1003.17 | | Monthly Target 2 | 1019.33 | | Monthly Target 3 | 1032.1666666667 | | Monthly Target 4 | 1048.33 | | Monthly Target 5 | 1061.17 |
Monthly price and volumes Serencd8 65
| Date |
Closing |
Open |
Range |
Volume |
Tue 28 October 2025 |
1035.50 (-1.29%) |
1016.30 |
1016.00 - 1045.00 |
0.535 times |
Tue 30 September 2025 |
1048.98 (1.84%) |
1025.00 |
1015.00 - 1049.00 |
0.5723 times |
Fri 29 August 2025 |
1030.00 (-4.63%) |
1099.00 |
1012.00 - 1120.00 |
1.4039 times |
Thu 31 July 2025 |
1080.00 (-0.64%) |
1085.00 |
1080.00 - 1099.00 |
1.1329 times |
Wed 25 June 2025 |
1086.99 (0.05%) |
1079.00 |
1070.00 - 1088.00 |
1.3163 times |
Wed 28 May 2025 |
1086.49 (1.84%) |
1067.01 |
1067.00 - 1100.00 |
0.9025 times |
Wed 30 April 2025 |
1066.89 (0.8%) |
1057.11 |
1050.30 - 1074.90 |
2.2852 times |
Wed 26 March 2025 |
1058.39 (0.94%) |
1050.26 |
1050.11 - 1078.00 |
0.6804 times |
Fri 28 February 2025 |
1048.50 (0%) |
1041.20 |
1041.20 - 1057.80 |
0.7032 times |
Fri 31 January 2025 |
1048.50 (0.43%) |
1040.01 |
1036.31 - 1120.00 |
0.4683 times |
Tue 31 December 2024 |
1044.00 (0.97%) |
1033.95 |
1030.00 - 1046.00 |
0.7586 times |
DMA SMA EMA moving averages of Serencd8 65 865TCAPS27_N8
DMA (daily moving average) of Serencd8 65 865TCAPS27_N8
| DMA period | DMA value | | 5 day DMA | 1030.38 | | 12 day DMA | 1025.06 | | 20 day DMA | 1026.08 | | 35 day DMA | 1024.71 | | 50 day DMA | 1037.4 | | 100 day DMA | 1058.76 | | 150 day DMA | 1056.55 | | 200 day DMA | 1050.58 | EMA (exponential moving average) of Serencd8 65 865TCAPS27_N8
| EMA period | EMA current | EMA prev | EMA prev2 | | 5 day EMA | 1032.6 | 1031.15 | 1024.23 | | 12 day EMA | 1028.37 | 1027.07 | 1023.81 | | 20 day EMA | 1028.13 | 1027.35 | 1025.49 | | 35 day EMA | 1034.58 | 1034.53 | 1033.91 | | 50 day EMA | 1041.04 | 1041.27 | 1041.12 |
SMA (simple moving average) of Serencd8 65 865TCAPS27_N8
| SMA period | SMA current | SMA prev | SMA prev2 | | 5 day SMA | 1030.38 | 1027.3 | 1022.3 | | 12 day SMA | 1025.06 | 1026.18 | 1024.43 | | 20 day SMA | 1026.08 | 1025.1 | 1023.76 | | 35 day SMA | 1024.71 | 1024.27 | 1023.49 | | 50 day SMA | 1037.4 | 1038.51 | 1039.48 | | 100 day SMA | 1058.76 | 1059.03 | 1059.18 | | 150 day SMA | 1056.55 | 1056.58 | 1056.61 | | 200 day SMA | 1050.58 | 1050.55 | 1050.44 |
|
|
