Bond8 865IRFC29_NA full analysis,charts,indicators,moving averages,SMA,DMA,EMA,ADX,MACD,RSIBond 8 865IRFC29_NA WideScreen charts, DMA,SMA,EMA technical analysis, forecast prediction, by indicators ADX,MACD,RSI,CCI NSE stock exchange
Daily price and charts and targets Bond8 Strong Daily Stock price targets for Bond8 865IRFC29_NA are 1131.63 and 1138.68 | Daily Target 1 | 1130.45 | | Daily Target 2 | 1132.8 | | Daily Target 3 | 1137.5 | | Daily Target 4 | 1139.85 | | Daily Target 5 | 1144.55 |
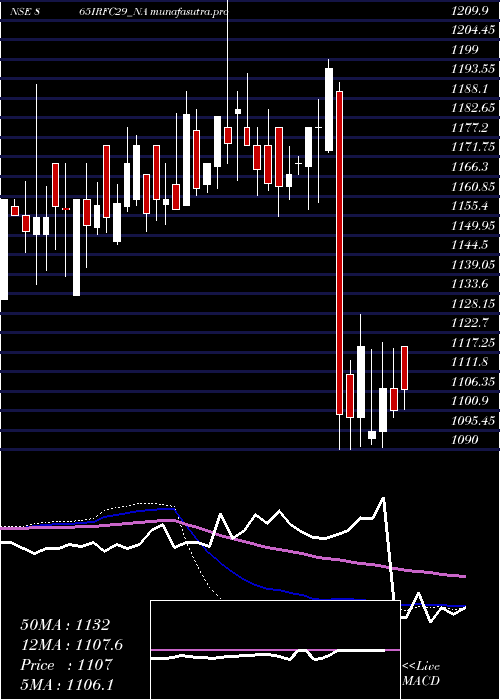
Daily price and volume Bond 8
| Date |
Closing |
Open |
Range |
Volume |
Wed 29 October 2025 |
1135.15 (-0.6%) |
1142.20 |
1135.15 - 1142.20 |
1.0251 times |
Tue 28 October 2025 |
1142.00 (0.17%) |
1142.00 |
1142.00 - 1142.00 |
2.5377 times |
Mon 27 October 2025 |
1140.10 (0.32%) |
1140.10 |
1140.10 - 1140.10 |
0.2513 times |
Fri 24 October 2025 |
1136.41 (0.12%) |
1135.01 |
1135.01 - 1163.69 |
0.7286 times |
Thu 23 October 2025 |
1135.01 (0.27%) |
1157.94 |
1135.01 - 1157.94 |
0.6935 times |
Tue 21 October 2025 |
1132.00 (0.17%) |
1132.00 |
1132.00 - 1132.00 |
0.005 times |
Mon 20 October 2025 |
1130.12 (-0.43%) |
1135.00 |
1130.12 - 1164.99 |
0.2864 times |
Fri 17 October 2025 |
1135.00 (0.34%) |
1135.00 |
1135.00 - 1135.00 |
0.1508 times |
Thu 16 October 2025 |
1131.15 (-1.54%) |
1135.05 |
1131.15 - 1135.10 |
4.3166 times |
Wed 15 October 2025 |
1148.79 (-0.1%) |
1148.79 |
1148.79 - 1148.79 |
0.005 times |
Tue 14 October 2025 |
1149.99 (0.52%) |
1149.99 |
1149.99 - 1149.99 |
0.0251 times |

Weekly price and charts Bond8 Strong weekly Stock price targets for Bond8 865IRFC29_NA are 1131.63 and 1138.68 | Weekly Target 1 | 1130.45 | | Weekly Target 2 | 1132.8 | | Weekly Target 3 | 1137.5 | | Weekly Target 4 | 1139.85 | | Weekly Target 5 | 1144.55 |
Weekly price and volumes for Bond 8
| Date |
Closing |
Open |
Range |
Volume |
Wed 29 October 2025 |
1135.15 (-0.11%) |
1140.10 |
1135.15 - 1142.20 |
0.2413 times |
Fri 24 October 2025 |
1136.41 (0.12%) |
1135.00 |
1130.12 - 1164.99 |
0.1084 times |
Fri 17 October 2025 |
1135.00 (0.83%) |
1125.69 |
1125.69 - 1149.99 |
0.51 times |
Fri 10 October 2025 |
1125.69 (-1.46%) |
1144.50 |
1120.12 - 1144.50 |
0.7186 times |
Fri 03 October 2025 |
1142.39 (1.43%) |
1126.00 |
1126.00 - 1182.95 |
2.0594 times |
Fri 26 September 2025 |
1126.25 (-0.42%) |
1134.00 |
1124.22 - 1134.00 |
0.882 times |
Fri 19 September 2025 |
1130.99 (0.09%) |
1132.00 |
1120.00 - 1137.00 |
2.3398 times |
Fri 12 September 2025 |
1129.99 (-0.7%) |
1137.78 |
1125.00 - 1141.00 |
1.8053 times |
Fri 05 September 2025 |
1137.98 (0.17%) |
1125.00 |
1125.00 - 1140.00 |
0.9218 times |
Fri 29 August 2025 |
1136.00 (0.53%) |
1123.50 |
1120.31 - 1136.00 |
0.4133 times |
Fri 22 August 2025 |
1130.00 (-0.7%) |
1138.00 |
1121.09 - 1150.00 |
2.4104 times |
Monthly price and charts Bond8 Strong monthly Stock price targets for Bond8 865IRFC29_NA are 1127.64 and 1172.51 | Monthly Target 1 | 1095.22 | | Monthly Target 2 | 1115.18 | | Monthly Target 3 | 1140.0866666667 | | Monthly Target 4 | 1160.05 | | Monthly Target 5 | 1184.96 |
Monthly price and volumes Bond 8
| Date |
Closing |
Open |
Range |
Volume |
Wed 29 October 2025 |
1135.15 (0.52%) |
1135.00 |
1120.12 - 1164.99 |
0.6121 times |
Tue 30 September 2025 |
1129.27 (-0.59%) |
1125.00 |
1120.00 - 1182.95 |
1.3312 times |
Fri 29 August 2025 |
1136.00 (0.53%) |
1130.00 |
1115.00 - 1150.00 |
1.3851 times |
Thu 31 July 2025 |
1130.00 (1.62%) |
1115.00 |
1105.50 - 1139.33 |
1.2563 times |
Mon 30 June 2025 |
1112.02 (-2.02%) |
1154.90 |
1105.42 - 1155.00 |
1.0105 times |
Fri 30 May 2025 |
1135.00 (3.21%) |
1108.50 |
1101.05 - 1170.00 |
1.0482 times |
Wed 30 April 2025 |
1099.67 (-0.03%) |
1111.00 |
1090.00 - 1127.88 |
1.782 times |
Fri 28 March 2025 |
1100.00 (-5.98%) |
1169.00 |
1090.10 - 1199.00 |
0.5245 times |
Fri 28 February 2025 |
1170.00 (0.16%) |
1175.00 |
1155.10 - 1185.00 |
0.3975 times |
Fri 31 January 2025 |
1168.10 (-0.42%) |
1175.00 |
1161.00 - 1389.90 |
0.6525 times |
Tue 31 December 2024 |
1173.00 (1.12%) |
1164.00 |
1157.00 - 1190.00 |
0.5796 times |
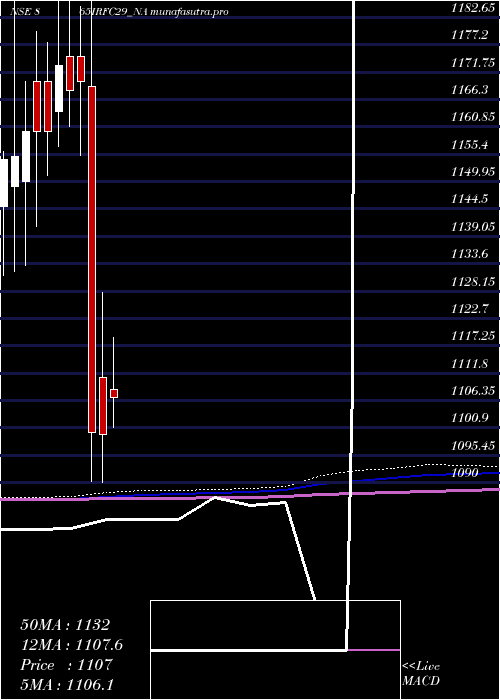
DMA SMA EMA moving averages of Bond 8 865IRFC29_NA
DMA (daily moving average) of Bond 8 865IRFC29_NA
| DMA period | DMA value | | 5 day DMA | 1137.73 | | 12 day DMA | 1138.31 | | 20 day DMA | 1137.87 | | 35 day DMA | 1134.51 | | 50 day DMA | 1134.3 | | 100 day DMA | 1126.65 | | 150 day DMA | 1124.8 | | 200 day DMA | 1137.5 | EMA (exponential moving average) of Bond 8 865IRFC29_NA
| EMA period | EMA current | EMA prev | EMA prev2 | | 5 day EMA | 1137.41 | 1138.54 | 1136.81 | | 12 day EMA | 1137.04 | 1137.38 | 1136.54 | | 20 day EMA | 1136.45 | 1136.59 | 1136.02 | | 35 day EMA | 1135.69 | 1135.72 | 1135.35 | | 50 day EMA | 1134.24 | 1134.2 | 1133.88 |
SMA (simple moving average) of Bond 8 865IRFC29_NA
| SMA period | SMA current | SMA prev | SMA prev2 | | 5 day SMA | 1137.73 | 1137.1 | 1134.73 | | 12 day SMA | 1138.31 | 1137.52 | 1137.27 | | 20 day SMA | 1137.87 | 1137.41 | 1136.62 | | 35 day SMA | 1134.51 | 1134.59 | 1134.47 | | 50 day SMA | 1134.3 | 1134.36 | 1134.14 | | 100 day SMA | 1126.65 | 1126.55 | 1126.38 | | 150 day SMA | 1124.8 | 1125.23 | 1125.49 | | 200 day SMA | 1137.5 | 1137.74 | 1137.9 |
|
|
