Bond8 863IRFC29_NC full analysis,charts,indicators,moving averages,SMA,DMA,EMA,ADX,MACD,RSIBond 8 863IRFC29_NC WideScreen charts, DMA,SMA,EMA technical analysis, forecast prediction, by indicators ADX,MACD,RSI,CCI NSE stock exchange
Daily price and charts and targets Bond8 Strong Daily Stock price targets for Bond8 863IRFC29_NC are 1165 and 1165 | Daily Target 1 | 1165 | | Daily Target 2 | 1165 | | Daily Target 3 | 1165 | | Daily Target 4 | 1165 | | Daily Target 5 | 1165 |
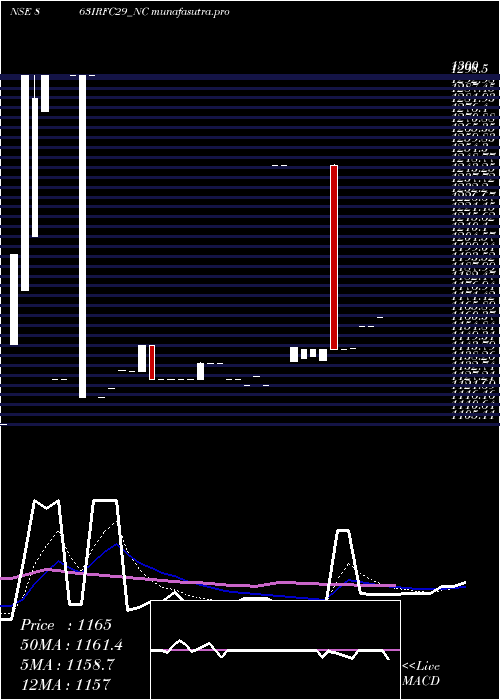
Daily price and volume Bond 8
| Date |
Closing |
Open |
Range |
Volume |
Tue 09 December 2025 |
1165.00 (0.43%) |
1165.00 |
1165.00 - 1165.00 |
0.0008 times |
Fri 05 December 2025 |
1160.00 (0%) |
1160.00 |
1160.00 - 1160.00 |
0.0092 times |
Wed 03 December 2025 |
1160.00 (1.1%) |
1160.00 |
1160.00 - 1160.00 |
0.0039 times |
Tue 18 November 2025 |
1147.40 (0.03%) |
1147.40 |
1147.40 - 1147.40 |
0.0039 times |
Fri 14 November 2025 |
1147.10 (0%) |
1147.10 |
1147.10 - 1147.10 |
0.0085 times |
Thu 06 November 2025 |
1147.10 (0.02%) |
1249.90 |
1147.10 - 1250.00 |
2.0819 times |
Tue 04 November 2025 |
1146.90 (-0.01%) |
1141.10 |
1141.10 - 1146.90 |
6.1662 times |
Wed 29 October 2025 |
1146.99 (-0%) |
1143.00 |
1143.00 - 1146.99 |
0.0462 times |
Tue 28 October 2025 |
1147.00 (-0.09%) |
1141.90 |
1141.90 - 1147.00 |
0.0462 times |
Mon 27 October 2025 |
1148.00 (-8.15%) |
1140.51 |
1140.50 - 1148.00 |
1.6333 times |
Mon 20 October 2025 |
1249.90 (0%) |
1249.90 |
1249.90 - 1249.90 |
0.0023 times |
Weekly price and charts Bond8 Strong weekly Stock price targets for Bond8 863IRFC29_NC are 1165 and 1165 | Weekly Target 1 | 1165 | | Weekly Target 2 | 1165 | | Weekly Target 3 | 1165 | | Weekly Target 4 | 1165 | | Weekly Target 5 | 1165 |
Weekly price and volumes for Bond 8
| Date |
Closing |
Open |
Range |
Volume |
Tue 09 December 2025 |
1165.00 (0.43%) |
1165.00 |
1165.00 - 1165.00 |
0.0007 times |
Fri 05 December 2025 |
1160.00 (1.12%) |
1147.40 |
1147.40 - 1160.00 |
0.0144 times |
Fri 14 November 2025 |
1147.10 (0.01%) |
1141.10 |
1141.10 - 1250.00 |
7.0238 times |
Wed 29 October 2025 |
1146.99 (-8.23%) |
1140.51 |
1140.50 - 1148.00 |
1.4681 times |
Mon 20 October 2025 |
1249.90 (0%) |
1249.90 |
1249.90 - 1249.90 |
0.002 times |
Tue 14 October 2025 |
1249.90 (10.42%) |
1127.10 |
1127.10 - 1249.90 |
0.0197 times |
Fri 03 October 2025 |
1132.00 (0.18%) |
1130.00 |
1127.10 - 1132.00 |
0.4728 times |
Tue 23 September 2025 |
1130.00 (-0.79%) |
1130.00 |
1130.00 - 1130.00 |
0.0013 times |
Tue 16 September 2025 |
1139.00 (-0%) |
1139.00 |
1139.00 - 1139.00 |
0.3534 times |
Tue 09 September 2025 |
1139.03 (0.8%) |
1130.00 |
1130.00 - 1140.00 |
0.6439 times |
Fri 22 August 2025 |
1130.00 (0%) |
1130.00 |
1130.00 - 1130.00 |
1.493 times |

Monthly price and charts Bond8 Strong monthly Stock price targets for Bond8 863IRFC29_NC are 1162.5 and 1167.5 | Monthly Target 1 | 1158.33 | | Monthly Target 2 | 1161.67 | | Monthly Target 3 | 1163.3333333333 | | Monthly Target 4 | 1166.67 | | Monthly Target 5 | 1168.33 |
Monthly price and volumes Bond 8
| Date |
Closing |
Open |
Range |
Volume |
Tue 09 December 2025 |
1165.00 (1.53%) |
1160.00 |
1160.00 - 1165.00 |
0.0045 times |
Tue 18 November 2025 |
1147.40 (0.04%) |
1141.10 |
1141.10 - 1250.00 |
2.6831 times |
Wed 29 October 2025 |
1146.99 (1.5%) |
1127.10 |
1127.10 - 1249.90 |
0.7243 times |
Mon 29 September 2025 |
1130.00 (0%) |
1130.00 |
1130.00 - 1140.00 |
0.4063 times |
Fri 22 August 2025 |
1130.00 (0.44%) |
1135.30 |
1130.00 - 1149.00 |
1.4739 times |
Tue 29 July 2025 |
1125.00 (-0.45%) |
1300.00 |
1120.00 - 1300.00 |
0.7746 times |
Fri 27 June 2025 |
1130.05 (-12.21%) |
1280.00 |
1130.05 - 1300.00 |
0.2541 times |
Fri 30 May 2025 |
1287.23 (14.42%) |
1130.00 |
1105.10 - 1300.00 |
1.3487 times |
Mon 28 April 2025 |
1125.00 (2.27%) |
1100.01 |
1099.35 - 1125.00 |
1.6912 times |
Fri 28 March 2025 |
1100.00 (-7.08%) |
1180.00 |
1100.00 - 1191.00 |
0.6394 times |
Tue 28 January 2025 |
1183.80 (-0.52%) |
1171.10 |
1171.00 - 1183.80 |
0.3217 times |

DMA SMA EMA moving averages of Bond 8 863IRFC29_NC
DMA (daily moving average) of Bond 8 863IRFC29_NC
| DMA period | DMA value | | 5 day DMA | 1155.9 | | 12 day DMA | 1167.94 | | 20 day DMA | 1153.93 | | 35 day DMA | 1158.66 | | 50 day DMA | 1158 | | 100 day DMA | | | 150 day DMA | | | 200 day DMA | | EMA (exponential moving average) of Bond 8 863IRFC29_NC
| EMA period | EMA current | EMA prev | EMA prev2 | | 5 day EMA | 1158.73 | 1155.59 | 1153.39 | | 12 day EMA | 1157.02 | 1155.57 | 1154.76 | | 20 day EMA | 1156.32 | 1155.41 | 1154.93 | | 35 day EMA | 1158.4 | 1158.01 | 1157.89 | | 50 day EMA | 1160 | 1159.8 | 1159.79 |
SMA (simple moving average) of Bond 8 863IRFC29_NC
| SMA period | SMA current | SMA prev | SMA prev2 | | 5 day SMA | 1155.9 | 1152.32 | 1149.7 | | 12 day SMA | 1167.94 | 1164.78 | 1162.45 | | 20 day SMA | 1153.93 | 1152.18 | 1150.68 | | 35 day SMA | 1158.66 | 1162.51 | 1166.15 | | 50 day SMA | 1158 | 1158.52 | 1158.7 | | 100 day SMA | | 150 day SMA | | 200 day SMA |
|
|
