SecRe 835SCL23B_YM full analysis,charts,indicators,moving averages,SMA,DMA,EMA,ADX,MACD,RSISec Re 835SCL23B_YM WideScreen charts, DMA,SMA,EMA technical analysis, forecast prediction, by indicators ADX,MACD,RSI,CCI NSE stock exchange
Daily price and charts and targets SecRe Strong Daily Stock price targets for SecRe 835SCL23B_YM are 950 and 950 | Daily Target 1 | 950 | | Daily Target 2 | 950 | | Daily Target 3 | 950 | | Daily Target 4 | 950 | | Daily Target 5 | 950 |
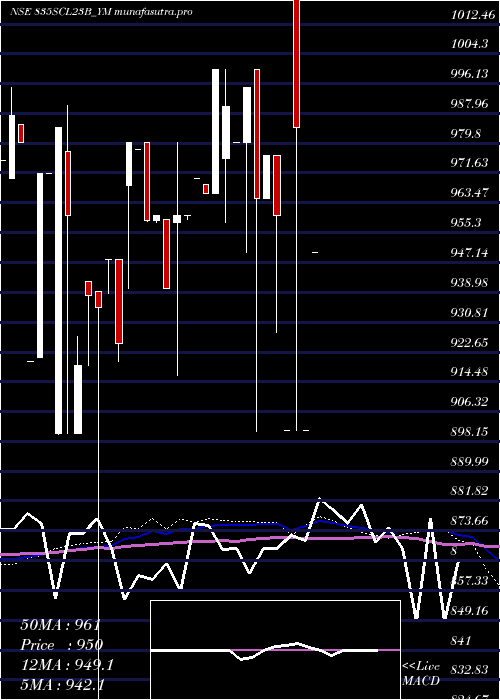
Daily price and volume Sec Re
| Date |
Closing |
Open |
Range |
Volume |
Tue 09 December 2025 |
950.00 (5.41%) |
950.00 |
950.00 - 950.00 |
0.3559 times |
Tue 04 November 2025 |
901.25 (-8.41%) |
901.25 |
901.25 - 901.25 |
0.0356 times |
Fri 31 October 2025 |
984.00 (1.44%) |
984.00 |
984.00 - 984.00 |
0.4982 times |
Thu 30 October 2025 |
970.00 (7.63%) |
970.00 |
970.00 - 970.00 |
0.0712 times |
Mon 20 October 2025 |
901.20 (0%) |
1081.44 |
901.20 - 1081.44 |
1.6726 times |
Wed 17 September 2025 |
901.20 (-6.13%) |
901.20 |
901.20 - 901.20 |
1.5658 times |
Thu 24 July 2025 |
960.00 (1.27%) |
960.00 |
960.00 - 960.00 |
4.8043 times |
Wed 23 July 2025 |
948.00 (-2.91%) |
928.00 |
928.00 - 948.00 |
0.2135 times |
Tue 08 July 2025 |
976.37 (0%) |
976.37 |
976.37 - 976.37 |
0.5338 times |
Mon 07 July 2025 |
976.37 (0%) |
976.37 |
976.37 - 976.37 |
0.2491 times |
Fri 04 July 2025 |
976.37 (0%) |
976.37 |
976.37 - 976.37 |
0.3559 times |

Weekly price and charts SecRe Strong weekly Stock price targets for SecRe 835SCL23B_YM are 950 and 950 | Weekly Target 1 | 950 | | Weekly Target 2 | 950 | | Weekly Target 3 | 950 | | Weekly Target 4 | 950 | | Weekly Target 5 | 950 |
Weekly price and volumes for Sec Re
| Date |
Closing |
Open |
Range |
Volume |
Tue 09 December 2025 |
950.00 (5.41%) |
950.00 |
950.00 - 950.00 |
0.0978 times |
Tue 04 November 2025 |
901.25 (-8.41%) |
901.25 |
901.25 - 901.25 |
0.0098 times |
Fri 31 October 2025 |
984.00 (9.19%) |
1081.44 |
901.20 - 1081.44 |
0.6164 times |
Wed 17 September 2025 |
901.20 (-6.13%) |
901.20 |
901.20 - 901.20 |
0.4305 times |
Thu 24 July 2025 |
960.00 (-1.68%) |
976.37 |
928.00 - 976.37 |
1.5949 times |
Fri 04 July 2025 |
976.37 (1.22%) |
964.64 |
964.64 - 976.37 |
1.4971 times |
Thu 19 June 2025 |
964.64 (-3.05%) |
1000.00 |
900.70 - 1000.00 |
0.4501 times |
Fri 13 June 2025 |
995.00 (1.53%) |
980.00 |
950.00 - 995.00 |
2.0548 times |
Fri 06 June 2025 |
980.00 (-1%) |
980.00 |
980.00 - 980.00 |
1.1742 times |
Fri 30 May 2025 |
989.91 (-1%) |
975.60 |
957.98 - 999.90 |
2.0744 times |
Thu 08 May 2025 |
999.90 (3.51%) |
966.00 |
966.00 - 999.90 |
0.9002 times |
Monthly price and charts SecRe Strong monthly Stock price targets for SecRe 835SCL23B_YM are 950 and 950 | Monthly Target 1 | 950 | | Monthly Target 2 | 950 | | Monthly Target 3 | 950 | | Monthly Target 4 | 950 | | Monthly Target 5 | 950 |
Monthly price and volumes Sec Re
| Date |
Closing |
Open |
Range |
Volume |
Tue 09 December 2025 |
950.00 (5.41%) |
950.00 |
950.00 - 950.00 |
0.0477 times |
Tue 04 November 2025 |
901.25 (-8.41%) |
901.25 |
901.25 - 901.25 |
0.0048 times |
Fri 31 October 2025 |
984.00 (9.19%) |
1081.44 |
901.20 - 1081.44 |
0.3004 times |
Wed 17 September 2025 |
901.20 (-6.13%) |
901.20 |
901.20 - 901.20 |
0.2098 times |
Thu 24 July 2025 |
960.00 (-0.48%) |
964.64 |
928.00 - 976.37 |
1.1969 times |
Mon 30 June 2025 |
964.64 (-2.55%) |
980.00 |
900.70 - 1000.00 |
2.103 times |
Fri 30 May 2025 |
989.91 (2.48%) |
966.00 |
957.98 - 999.90 |
1.5689 times |
Wed 30 April 2025 |
966.00 (2.77%) |
958.00 |
916.00 - 980.00 |
1.5498 times |
Fri 28 March 2025 |
940.00 (-3.89%) |
980.00 |
940.00 - 980.00 |
1.3162 times |
Fri 28 February 2025 |
978.00 (3.16%) |
940.00 |
920.00 - 980.00 |
1.7024 times |
Mon 23 December 2024 |
948.00 (1.06%) |
939.27 |
816.50 - 948.00 |
1.3257 times |
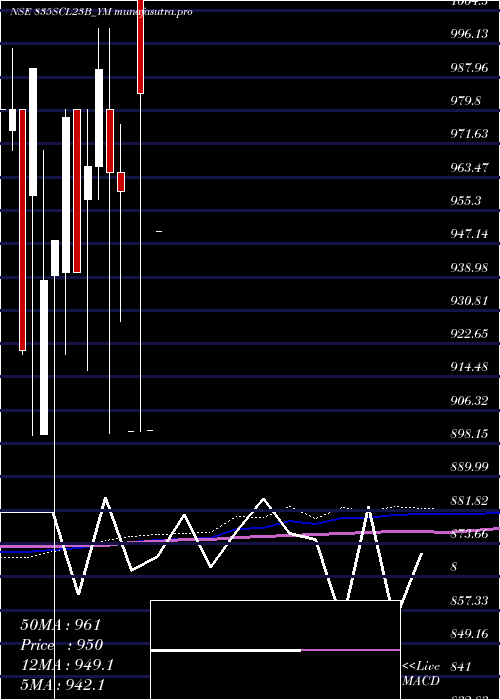
DMA SMA EMA moving averages of Sec Re 835SCL23B_YM
DMA (daily moving average) of Sec Re 835SCL23B_YM
| DMA period | DMA value | | 5 day DMA | 941.29 | | 12 day DMA | 951.76 | | 20 day DMA | 959.98 | | 35 day DMA | 968.43 | | 50 day DMA | 964.83 | | 100 day DMA | | | 150 day DMA | | | 200 day DMA | | EMA (exponential moving average) of Sec Re 835SCL23B_YM
| EMA period | EMA current | EMA prev | EMA prev2 | | 5 day EMA | 942.05 | 938.07 | 956.47 | | 12 day EMA | 949.05 | 948.88 | 957.54 | | 20 day EMA | 955.26 | 955.81 | 961.55 | | 35 day EMA | 959.28 | 959.83 | 963.28 | | 50 day EMA | 962.68 | 963.2 | 965.73 |
SMA (simple moving average) of Sec Re 835SCL23B_YM
| SMA period | SMA current | SMA prev | SMA prev2 | | 5 day SMA | 941.29 | 931.53 | 943.28 | | 12 day SMA | 951.76 | 952.98 | 958.26 | | 20 day SMA | 959.98 | 961.48 | 965.42 | | 35 day SMA | 968.43 | 968.96 | 970.92 | | 50 day SMA | 964.83 | 965.43 | 966.97 | | 100 day SMA | | 150 day SMA | | 200 day SMA |
|
|
