GoiLoan 832GS2032_GS full analysis,charts,indicators,moving averages,SMA,DMA,EMA,ADX,MACD,RSIGoi Loan 832GS2032_GS WideScreen charts, DMA,SMA,EMA technical analysis, forecast prediction, by indicators ADX,MACD,RSI,CCI NSE stock exchange
Daily price and charts and targets GoiLoan Strong Daily Stock price targets for GoiLoan 832GS2032_GS are 110 and 112 | Daily Target 1 | 108.33 | | Daily Target 2 | 109.67 | | Daily Target 3 | 110.33333333333 | | Daily Target 4 | 111.67 | | Daily Target 5 | 112.33 |
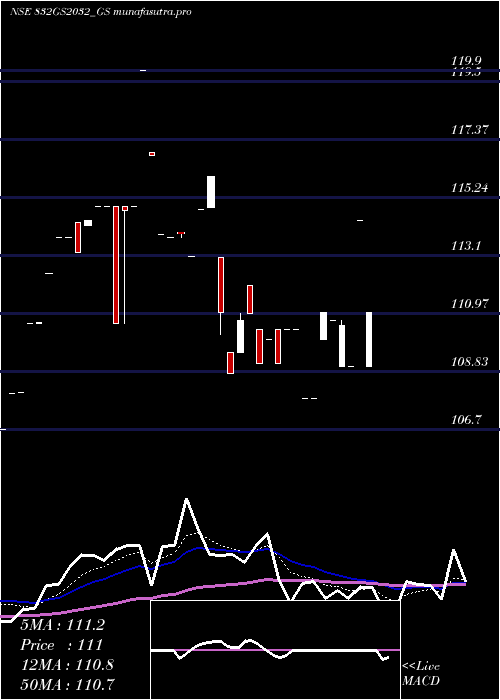
Daily price and volume Goi Loan
| Date |
Closing |
Open |
Range |
Volume |
Mon 27 October 2025 |
111.00 (-2.97%) |
109.00 |
109.00 - 111.00 |
0.5745 times |
Fri 24 October 2025 |
114.40 (4.95%) |
114.40 |
114.40 - 114.40 |
0.3131 times |
Wed 15 October 2025 |
109.00 (-1.36%) |
109.00 |
109.00 - 109.00 |
0.0115 times |
Wed 01 October 2025 |
110.50 (-0.18%) |
109.00 |
109.00 - 110.70 |
2.8239 times |
Tue 30 September 2025 |
110.70 (-0.27%) |
110.70 |
110.70 - 110.70 |
0.0029 times |
Mon 22 September 2025 |
111.00 (2.97%) |
110.00 |
110.00 - 111.00 |
1.0629 times |
Mon 15 September 2025 |
107.80 (-0.01%) |
107.80 |
107.80 - 107.80 |
2.8727 times |
Wed 10 September 2025 |
107.81 (-2.3%) |
107.80 |
107.80 - 107.81 |
0.0287 times |
Tue 26 August 2025 |
110.35 (0%) |
110.35 |
110.35 - 110.35 |
1.1606 times |
Tue 19 August 2025 |
110.35 (1.15%) |
110.35 |
110.35 - 110.35 |
1.1491 times |
Mon 18 August 2025 |
109.10 (-0.82%) |
110.35 |
109.10 - 110.35 |
1.4421 times |
Weekly price and charts GoiLoan Strong weekly Stock price targets for GoiLoan 832GS2032_GS are 110 and 112 | Weekly Target 1 | 108.33 | | Weekly Target 2 | 109.67 | | Weekly Target 3 | 110.33333333333 | | Weekly Target 4 | 111.67 | | Weekly Target 5 | 112.33 |
Weekly price and volumes for Goi Loan
| Date |
Closing |
Open |
Range |
Volume |
Mon 27 October 2025 |
111.00 (-2.97%) |
109.00 |
109.00 - 111.00 |
0.0661 times |
Fri 24 October 2025 |
114.40 (3.53%) |
109.00 |
109.00 - 114.40 |
0.0374 times |
Wed 01 October 2025 |
110.50 (2.5%) |
110.00 |
109.00 - 111.00 |
0.4477 times |
Mon 15 September 2025 |
107.80 (-0.01%) |
107.80 |
107.80 - 107.80 |
0.3307 times |
Wed 10 September 2025 |
107.81 (-2.3%) |
110.35 |
107.80 - 110.35 |
0.1369 times |
Tue 19 August 2025 |
110.35 (0.32%) |
110.35 |
109.10 - 110.35 |
0.2983 times |
Thu 14 August 2025 |
110.00 (-0.86%) |
110.35 |
109.10 - 110.35 |
0.414 times |
Fri 08 August 2025 |
110.95 (-4.35%) |
113.00 |
108.75 - 113.00 |
3.0097 times |
Thu 17 July 2025 |
116.00 (2.61%) |
114.80 |
114.80 - 116.00 |
5.127 times |
Wed 09 July 2025 |
113.05 (-0.75%) |
113.05 |
113.05 - 113.05 |
0.1323 times |
Fri 04 July 2025 |
113.90 (-2.48%) |
113.88 |
113.75 - 113.95 |
9.9564 times |

Monthly price and charts GoiLoan Strong monthly Stock price targets for GoiLoan 832GS2032_GS are 110 and 115.4 | Monthly Target 1 | 106.07 | | Monthly Target 2 | 108.53 | | Monthly Target 3 | 111.46666666667 | | Monthly Target 4 | 113.93 | | Monthly Target 5 | 116.87 |
Monthly price and volumes Goi Loan
| Date |
Closing |
Open |
Range |
Volume |
Mon 27 October 2025 |
111.00 (0.27%) |
109.00 |
109.00 - 114.40 |
0.1229 times |
Tue 30 September 2025 |
110.70 (0.32%) |
107.80 |
107.80 - 111.00 |
0.1309 times |
Tue 26 August 2025 |
110.35 (-4.87%) |
113.00 |
108.75 - 113.00 |
1.1054 times |
Thu 17 July 2025 |
116.00 (1.86%) |
113.75 |
113.05 - 116.00 |
4.3618 times |
Mon 23 June 2025 |
113.88 (-0.88%) |
119.90 |
113.88 - 119.90 |
0.0197 times |
Thu 29 May 2025 |
114.89 (2.17%) |
113.75 |
110.60 - 114.90 |
1.0283 times |
Mon 28 April 2025 |
112.45 (4.07%) |
110.60 |
110.60 - 112.45 |
0.864 times |
Thu 20 March 2025 |
108.05 (-1.01%) |
106.85 |
106.70 - 109.50 |
2.2624 times |
Tue 18 February 2025 |
109.15 (-0.48%) |
109.15 |
109.15 - 109.15 |
0.0567 times |
Mon 20 January 2025 |
109.68 (5%) |
109.68 |
109.68 - 112.50 |
0.0478 times |
Wed 18 December 2024 |
104.46 (-4.01%) |
111.40 |
104.46 - 111.40 |
0.0469 times |

DMA SMA EMA moving averages of Goi Loan 832GS2032_GS
DMA (daily moving average) of Goi Loan 832GS2032_GS
| DMA period | DMA value | | 5 day DMA | 111.12 | | 12 day DMA | 110.17 | | 20 day DMA | 110.82 | | 35 day DMA | 112.35 | | 50 day DMA | 111.35 | | 100 day DMA | | | 150 day DMA | | | 200 day DMA | | EMA (exponential moving average) of Goi Loan 832GS2032_GS
| EMA period | EMA current | EMA prev | EMA prev2 | | 5 day EMA | 111.2 | 111.3 | 109.75 | | 12 day EMA | 110.82 | 110.79 | 110.13 | | 20 day EMA | 111 | 111 | 110.64 | | 35 day EMA | 110.87 | 110.86 | 110.65 | | 50 day EMA | 111.14 | 111.15 | 111.02 |
SMA (simple moving average) of Goi Loan 832GS2032_GS
| SMA period | SMA current | SMA prev | SMA prev2 | | 5 day SMA | 111.12 | 111.12 | 109.8 | | 12 day SMA | 110.17 | 110.01 | 109.72 | | 20 day SMA | 110.82 | 110.96 | 110.93 | | 35 day SMA | 112.35 | 112.34 | 112.23 | | 50 day SMA | 111.35 | 111.3 | 111.09 | | 100 day SMA | | 150 day SMA | | 200 day SMA |
|
|
