GoiLoan 828GS2027_GS full analysis,charts,indicators,moving averages,SMA,DMA,EMA,ADX,MACD,RSIGoi Loan 828GS2027_GS WideScreen charts, DMA,SMA,EMA technical analysis, forecast prediction, by indicators ADX,MACD,RSI,CCI NSE stock exchange
Daily price and charts and targets GoiLoan Strong Daily Stock price targets for GoiLoan 828GS2027_GS are 102.7 and 107.8 | Daily Target 1 | 101.73 | | Daily Target 2 | 103.67 | | Daily Target 3 | 106.83333333333 | | Daily Target 4 | 108.77 | | Daily Target 5 | 111.93 |
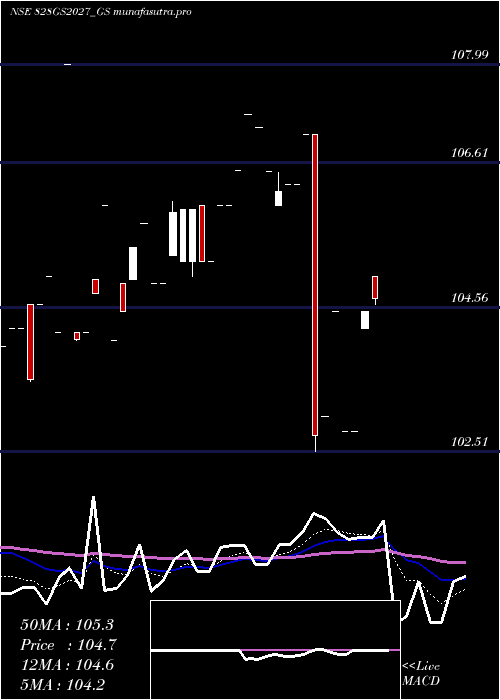
Daily price and volume Goi Loan
| Date |
Closing |
Open |
Range |
Volume |
Wed 10 December 2025 |
105.60 (-0.09%) |
105.95 |
104.90 - 110.00 |
3.3309 times |
Tue 09 December 2025 |
105.69 (-4.96%) |
116.70 |
105.64 - 116.75 |
2.6442 times |
Mon 08 December 2025 |
111.20 (4.96%) |
111.20 |
111.20 - 111.20 |
0.0006 times |
Fri 05 December 2025 |
105.95 (-3.68%) |
104.53 |
104.53 - 106.00 |
1.8971 times |
Thu 04 December 2025 |
110.00 (0%) |
115.50 |
110.00 - 115.50 |
0.1416 times |
Wed 03 December 2025 |
110.00 (-1.08%) |
110.00 |
110.00 - 110.00 |
0.4197 times |
Tue 02 December 2025 |
111.20 (4.91%) |
111.30 |
111.20 - 111.30 |
0.0011 times |
Thu 27 November 2025 |
106.00 (0.19%) |
106.00 |
106.00 - 106.00 |
1.5558 times |
Wed 26 November 2025 |
105.80 (2.17%) |
106.00 |
105.80 - 106.00 |
0.0056 times |
Tue 18 November 2025 |
103.55 (-2.31%) |
103.50 |
103.50 - 103.55 |
0.0034 times |
Thu 13 November 2025 |
106.00 (1.15%) |
106.00 |
106.00 - 106.00 |
0.5596 times |
Weekly price and charts GoiLoan Strong weekly Stock price targets for GoiLoan 828GS2027_GS are 99.33 and 111.18 | Weekly Target 1 | 97.23 | | Weekly Target 2 | 101.42 | | Weekly Target 3 | 109.08333333333 | | Weekly Target 4 | 113.27 | | Weekly Target 5 | 120.93 |
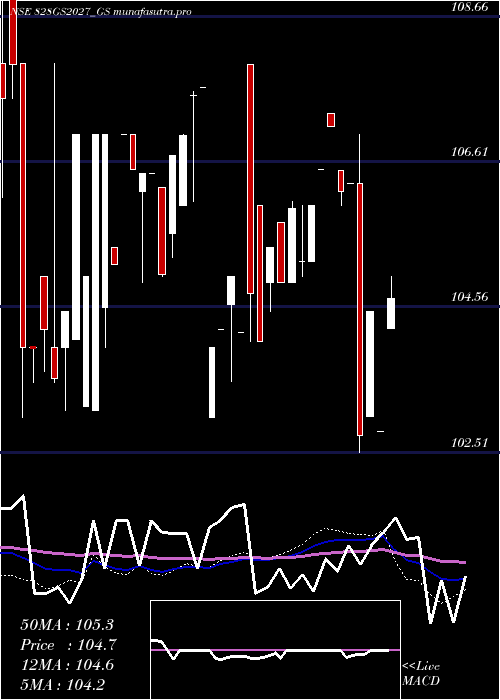
Weekly price and volumes for Goi Loan
| Date |
Closing |
Open |
Range |
Volume |
Wed 10 December 2025 |
105.60 (-0.33%) |
111.20 |
104.90 - 116.75 |
2.8752 times |
Fri 05 December 2025 |
105.95 (-0.05%) |
111.30 |
104.53 - 115.50 |
1.1834 times |
Thu 27 November 2025 |
106.00 (0%) |
103.50 |
103.50 - 106.00 |
0.7529 times |
Thu 13 November 2025 |
106.00 (0.95%) |
104.20 |
104.20 - 106.00 |
2.0383 times |
Tue 04 November 2025 |
105.00 (0.96%) |
104.00 |
104.00 - 105.00 |
0.2617 times |
Fri 31 October 2025 |
104.00 (-0.86%) |
103.50 |
103.50 - 104.90 |
0.6783 times |
Thu 23 October 2025 |
104.90 (0%) |
104.90 |
104.80 - 104.90 |
0.2983 times |
Thu 16 October 2025 |
104.90 (0.87%) |
104.90 |
104.90 - 104.90 |
0.0299 times |
Wed 08 October 2025 |
104.00 (0.48%) |
103.50 |
103.50 - 108.00 |
0.5019 times |
Fri 03 October 2025 |
103.50 (-3.32%) |
107.01 |
103.50 - 111.99 |
1.38 times |
Fri 05 September 2025 |
107.05 (-0.79%) |
108.50 |
107.05 - 108.50 |
0.0199 times |
Monthly price and charts GoiLoan Strong monthly Stock price targets for GoiLoan 828GS2027_GS are 98.96 and 111.18 | Monthly Target 1 | 96.74 | | Monthly Target 2 | 101.17 | | Monthly Target 3 | 108.96 | | Monthly Target 4 | 113.39 | | Monthly Target 5 | 121.18 |
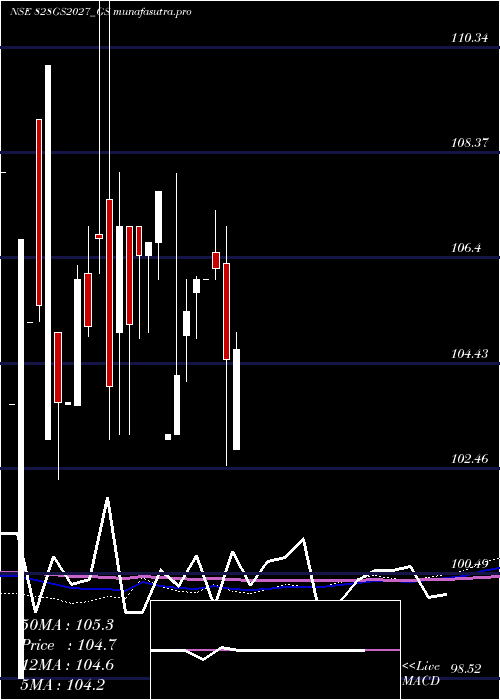
Monthly price and volumes Goi Loan
| Date |
Closing |
Open |
Range |
Volume |
Wed 10 December 2025 |
105.60 (-0.38%) |
111.30 |
104.53 - 116.75 |
0.2104 times |
Thu 27 November 2025 |
106.00 (1.92%) |
104.00 |
103.50 - 106.00 |
0.1583 times |
Fri 31 October 2025 |
104.00 (-2.81%) |
111.99 |
103.50 - 111.99 |
0.1494 times |
Wed 10 September 2025 |
107.01 (-0.82%) |
108.50 |
107.01 - 108.50 |
0.0014 times |
Thu 28 August 2025 |
107.90 (-7.41%) |
110.71 |
107.00 - 110.71 |
7.4158 times |
Fri 27 June 2025 |
116.54 (-5%) |
116.54 |
116.54 - 116.54 |
0 times |
Fri 30 May 2025 |
122.68 (17.2%) |
105.00 |
105.00 - 122.68 |
0.0197 times |
Thu 24 April 2025 |
104.68 (0.17%) |
102.80 |
102.80 - 105.00 |
0.4585 times |
Fri 28 March 2025 |
104.50 (-1.6%) |
106.30 |
102.51 - 107.00 |
0.7628 times |
Fri 28 February 2025 |
106.20 (0.19%) |
106.50 |
106.00 - 107.29 |
0.8238 times |
Thu 02 January 2025 |
106.00 (0%) |
106.00 |
106.00 - 106.00 |
0.013 times |
DMA SMA EMA moving averages of Goi Loan 828GS2027_GS
DMA (daily moving average) of Goi Loan 828GS2027_GS
| DMA period | DMA value | | 5 day DMA | 107.69 | | 12 day DMA | 107.15 | | 20 day DMA | 106.03 | | 35 day DMA | 106.13 | | 50 day DMA | 106.77 | | 100 day DMA | 106.24 | | 150 day DMA | 106.18 | | 200 day DMA | | EMA (exponential moving average) of Goi Loan 828GS2027_GS
| EMA period | EMA current | EMA prev | EMA prev2 | | 5 day EMA | 107.11 | 107.87 | 108.96 | | 12 day EMA | 107.06 | 107.33 | 107.63 | | 20 day EMA | 106.72 | 106.84 | 106.96 | | 35 day EMA | 106.71 | 106.78 | 106.84 | | 50 day EMA | 106.82 | 106.87 | 106.92 |
SMA (simple moving average) of Goi Loan 828GS2027_GS
| SMA period | SMA current | SMA prev | SMA prev2 | | 5 day SMA | 107.69 | 108.57 | 109.67 | | 12 day SMA | 107.15 | 107.1 | 107.04 | | 20 day SMA | 106.03 | 106 | 105.96 | | 35 day SMA | 106.13 | 106.2 | 106.34 | | 50 day SMA | 106.77 | 106.79 | 106.8 | | 100 day SMA | 106.24 | 106.25 | 106.26 | | 150 day SMA | 106.18 | 106.18 | 106.17 | | 200 day SMA |
|
|
