Bond8 810IRFC27_N2 full analysis,charts,indicators,moving averages,SMA,DMA,EMA,ADX,MACD,RSIBond 8 810IRFC27_N2 WideScreen charts, DMA,SMA,EMA technical analysis, forecast prediction, by indicators ADX,MACD,RSI,CCI NSE stock exchange
Daily price and charts and targets Bond8 Strong Daily Stock price targets for Bond8 810IRFC27_N2 are 1047.9 and 1047.9 | Daily Target 1 | 1047.9 | | Daily Target 2 | 1047.9 | | Daily Target 3 | 1047.9 | | Daily Target 4 | 1047.9 | | Daily Target 5 | 1047.9 |
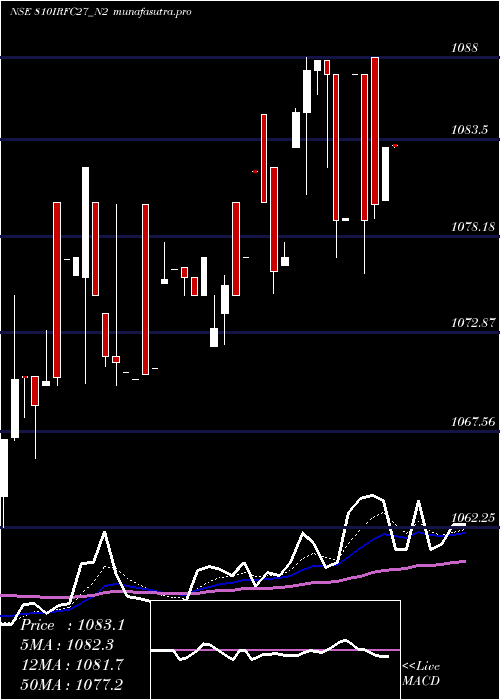
Daily price and volume Bond 8
| Date |
Closing |
Open |
Range |
Volume |
Tue 28 October 2025 |
1047.90 (0.37%) |
1047.90 |
1047.90 - 1047.90 |
0.6652 times |
Mon 27 October 2025 |
1044.00 (-0.28%) |
1046.00 |
1044.00 - 1046.80 |
0.1863 times |
Fri 24 October 2025 |
1046.89 (-0.01%) |
1047.00 |
1046.89 - 1049.00 |
0.3548 times |
Thu 23 October 2025 |
1047.02 (0.29%) |
1049.90 |
1047.00 - 1049.90 |
0.3264 times |
Mon 20 October 2025 |
1044.00 (0.43%) |
1045.90 |
1044.00 - 1045.90 |
0.5411 times |
Fri 17 October 2025 |
1039.50 (0.34%) |
1039.50 |
1039.50 - 1039.50 |
1.4405 times |
Thu 16 October 2025 |
1035.95 (0.26%) |
1039.00 |
1033.35 - 1039.00 |
2.1341 times |
Wed 15 October 2025 |
1033.23 (-0.06%) |
1032.52 |
1032.51 - 1033.23 |
0.1597 times |
Tue 14 October 2025 |
1033.82 (0.04%) |
1033.37 |
1030.20 - 1038.00 |
0.816 times |
Mon 13 October 2025 |
1033.37 (-0.4%) |
1034.99 |
1033.02 - 1036.00 |
3.3759 times |
Fri 10 October 2025 |
1037.50 (0.63%) |
1038.00 |
1037.00 - 1038.00 |
0.1774 times |
Weekly price and charts Bond8 Strong weekly Stock price targets for Bond8 810IRFC27_N2 are 1045.95 and 1049.85 | Weekly Target 1 | 1042.7 | | Weekly Target 2 | 1045.3 | | Weekly Target 3 | 1046.6 | | Weekly Target 4 | 1049.2 | | Weekly Target 5 | 1050.5 |
Weekly price and volumes for Bond 8
| Date |
Closing |
Open |
Range |
Volume |
Tue 28 October 2025 |
1047.90 (0.1%) |
1046.00 |
1044.00 - 1047.90 |
0.104 times |
Fri 24 October 2025 |
1046.89 (0.71%) |
1045.90 |
1044.00 - 1049.90 |
0.1493 times |
Fri 17 October 2025 |
1039.50 (0.19%) |
1034.99 |
1030.20 - 1039.50 |
0.9683 times |
Fri 10 October 2025 |
1037.50 (0.78%) |
1029.30 |
1028.60 - 1039.00 |
1.875 times |
Fri 03 October 2025 |
1029.50 (-7.31%) |
1110.00 |
1029.00 - 1110.00 |
1.1512 times |
Thu 25 September 2025 |
1110.70 (0.3%) |
1110.00 |
1107.60 - 1112.49 |
1.8444 times |
Fri 19 September 2025 |
1107.40 (0.17%) |
1106.20 |
1106.02 - 1120.70 |
1.1193 times |
Fri 12 September 2025 |
1105.50 (-1.29%) |
1119.00 |
1105.50 - 1119.00 |
0.0954 times |
Fri 05 September 2025 |
1119.99 (0.99%) |
1109.00 |
1104.13 - 1120.00 |
1.6925 times |
Thu 28 August 2025 |
1109.00 (0.36%) |
1114.00 |
1103.11 - 1120.00 |
1.0008 times |
Fri 22 August 2025 |
1105.05 (0.43%) |
1101.02 |
1101.02 - 1115.00 |
1.2929 times |

Monthly price and charts Bond8 Strong monthly Stock price targets for Bond8 810IRFC27_N2 are 1038.25 and 1059.55 | Monthly Target 1 | 1020.83 | | Monthly Target 2 | 1034.37 | | Monthly Target 3 | 1042.1333333333 | | Monthly Target 4 | 1055.67 | | Monthly Target 5 | 1063.43 |
Monthly price and volumes Bond 8
| Date |
Closing |
Open |
Range |
Volume |
Tue 28 October 2025 |
1047.90 (1.81%) |
1029.40 |
1028.60 - 1049.90 |
0.7323 times |
Tue 30 September 2025 |
1029.31 (-7.19%) |
1109.00 |
1029.00 - 1120.70 |
1.2131 times |
Thu 28 August 2025 |
1109.00 (1.01%) |
1098.40 |
1098.40 - 1120.00 |
1.1205 times |
Tue 29 July 2025 |
1097.90 (-0.25%) |
1099.00 |
1092.56 - 1103.05 |
0.4889 times |
Mon 30 June 2025 |
1100.70 (0.52%) |
1093.26 |
1074.10 - 1100.70 |
0.8192 times |
Fri 30 May 2025 |
1095.00 (0.92%) |
1086.05 |
1080.60 - 1100.00 |
1.4455 times |
Wed 30 April 2025 |
1085.00 (0.74%) |
1083.00 |
1076.10 - 1088.00 |
0.7352 times |
Fri 28 March 2025 |
1076.98 (0.59%) |
1070.30 |
1070.30 - 1084.90 |
0.7274 times |
Fri 28 February 2025 |
1070.70 (0.07%) |
1070.00 |
1062.25 - 1082.00 |
1.6519 times |
Fri 31 January 2025 |
1070.00 (0%) |
1070.00 |
1066.10 - 1084.50 |
1.0661 times |
Tue 31 December 2024 |
1070.00 (0%) |
1072.97 |
1063.20 - 1083.80 |
0.8862 times |

DMA SMA EMA moving averages of Bond 8 810IRFC27_N2
DMA (daily moving average) of Bond 8 810IRFC27_N2
| DMA period | DMA value | | 5 day DMA | 1045.96 | | 12 day DMA | 1039.52 | | 20 day DMA | 1047.54 | | 35 day DMA | 1074.99 | | 50 day DMA | 1083.25 | | 100 day DMA | 1088.39 | | 150 day DMA | 1084.52 | | 200 day DMA | 1081.08 | EMA (exponential moving average) of Bond 8 810IRFC27_N2
| EMA period | EMA current | EMA prev | EMA prev2 | | 5 day EMA | 1045.04 | 1043.61 | 1043.42 | | 12 day EMA | 1045.43 | 1044.98 | 1045.16 | | 20 day EMA | 1052.35 | 1052.82 | 1053.75 | | 35 day EMA | 1064.14 | 1065.1 | 1066.34 | | 50 day EMA | 1080.87 | 1082.22 | 1083.78 |
SMA (simple moving average) of Bond 8 810IRFC27_N2
| SMA period | SMA current | SMA prev | SMA prev2 | | 5 day SMA | 1045.96 | 1044.28 | 1042.67 | | 12 day SMA | 1039.52 | 1038.06 | 1036.89 | | 20 day SMA | 1047.54 | 1050.77 | 1053.95 | | 35 day SMA | 1074.99 | 1076.74 | 1078.48 | | 50 day SMA | 1083.25 | 1084.27 | 1085.45 | | 100 day SMA | 1088.39 | 1088.76 | 1089.17 | | 150 day SMA | 1084.52 | 1084.65 | 1084.82 | | 200 day SMA | 1081.08 | 1081.15 | 1081.26 |
|
|
