SecRe 79NHIT47_N3 full analysis,charts,indicators,moving averages,SMA,DMA,EMA,ADX,MACD,RSISec Re 79NHIT47_N3 WideScreen charts, DMA,SMA,EMA technical analysis, forecast prediction, by indicators ADX,MACD,RSI,CCI NSE stock exchange
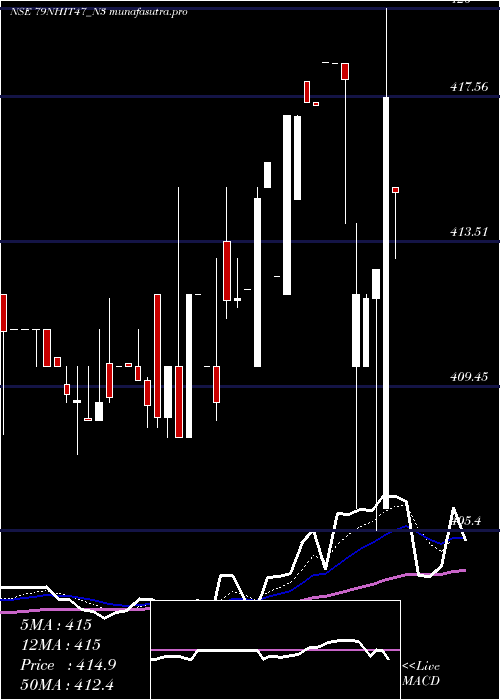
Daily price and charts and targets SecRe Strong Daily Stock price targets for SecRe 79NHIT47_N3 are 420.86 and 428.57 | Daily Target 1 | 414.43 | | Daily Target 2 | 419.57 | | Daily Target 3 | 422.14 | | Daily Target 4 | 427.28 | | Daily Target 5 | 429.85 |
Daily price and volume Sec Re
| Date |
Closing |
Open |
Range |
Volume |
Tue 28 October 2025 |
424.71 (0.44%) |
419.00 |
417.00 - 424.71 |
0.1647 times |
Mon 27 October 2025 |
422.86 (0.44%) |
424.99 |
420.00 - 424.99 |
1.8458 times |
Fri 24 October 2025 |
421.01 (0.48%) |
433.95 |
419.00 - 433.95 |
3.5461 times |
Tue 21 October 2025 |
419.00 (0.99%) |
419.00 |
419.00 - 419.00 |
0.0274 times |
Mon 20 October 2025 |
414.90 (-1.1%) |
414.00 |
413.50 - 414.90 |
2.0761 times |
Fri 17 October 2025 |
419.50 (-0.14%) |
419.50 |
419.50 - 419.50 |
0.0251 times |
Thu 16 October 2025 |
420.07 (0.06%) |
419.51 |
419.50 - 420.40 |
0.5095 times |
Wed 15 October 2025 |
419.80 (-0.04%) |
419.00 |
419.00 - 419.80 |
0.0573 times |
Mon 13 October 2025 |
419.95 (-0.2%) |
419.99 |
419.95 - 419.99 |
0.2386 times |
Fri 10 October 2025 |
420.81 (-1.63%) |
422.65 |
417.00 - 422.65 |
1.5094 times |
Thu 09 October 2025 |
427.80 (0%) |
427.80 |
427.80 - 427.80 |
0.0024 times |
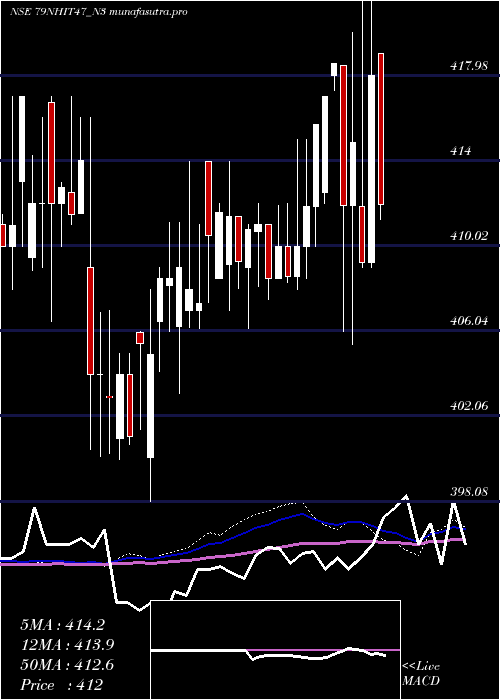
Weekly price and charts SecRe Strong weekly Stock price targets for SecRe 79NHIT47_N3 are 416.86 and 424.85 | Weekly Target 1 | 414.24 | | Weekly Target 2 | 419.48 | | Weekly Target 3 | 422.23333333333 | | Weekly Target 4 | 427.47 | | Weekly Target 5 | 430.22 |
Weekly price and volumes for Sec Re
| Date |
Closing |
Open |
Range |
Volume |
Tue 28 October 2025 |
424.71 (0.88%) |
424.99 |
417.00 - 424.99 |
0.9002 times |
Fri 24 October 2025 |
421.01 (0.36%) |
414.00 |
413.50 - 433.95 |
2.5295 times |
Fri 17 October 2025 |
419.50 (-0.31%) |
419.99 |
419.00 - 420.40 |
0.3718 times |
Fri 10 October 2025 |
420.81 (-3.01%) |
425.40 |
417.00 - 427.80 |
1.6123 times |
Fri 03 October 2025 |
433.86 (1.89%) |
435.50 |
424.55 - 435.50 |
0.5048 times |
Fri 26 September 2025 |
425.80 (0.04%) |
417.10 |
417.10 - 426.65 |
0.2351 times |
Fri 19 September 2025 |
425.62 (0.26%) |
418.05 |
418.05 - 426.20 |
1.6641 times |
Fri 12 September 2025 |
424.50 (-0.12%) |
430.00 |
420.00 - 459.19 |
1.3003 times |
Fri 05 September 2025 |
425.00 (0.47%) |
427.20 |
423.80 - 430.00 |
0.6421 times |
Fri 29 August 2025 |
423.00 (-0.04%) |
433.00 |
423.00 - 433.00 |
0.2399 times |
Thu 21 August 2025 |
423.16 (-1.36%) |
429.00 |
416.00 - 429.00 |
0.594 times |
Monthly price and charts SecRe Strong monthly Stock price targets for SecRe 79NHIT47_N3 are 408.87 and 429.35 | Monthly Target 1 | 403.58 | | Monthly Target 2 | 414.15 | | Monthly Target 3 | 424.06333333333 | | Monthly Target 4 | 434.63 | | Monthly Target 5 | 444.54 |
Monthly price and volumes Sec Re
| Date |
Closing |
Open |
Range |
Volume |
Tue 28 October 2025 |
424.71 (-0.17%) |
433.98 |
413.50 - 433.98 |
0.8253 times |
Mon 29 September 2025 |
425.45 (0.58%) |
427.20 |
417.10 - 459.19 |
0.5833 times |
Fri 29 August 2025 |
423.00 (-0.49%) |
425.10 |
416.00 - 437.06 |
0.3516 times |
Thu 31 July 2025 |
425.10 (1.65%) |
418.70 |
413.40 - 483.86 |
1.3102 times |
Mon 30 June 2025 |
418.19 (0.45%) |
416.00 |
405.00 - 425.60 |
1.5827 times |
Fri 30 May 2025 |
416.30 (0.34%) |
425.26 |
409.51 - 425.26 |
0.9606 times |
Wed 30 April 2025 |
414.88 (-0.5%) |
417.98 |
405.40 - 435.99 |
0.7261 times |
Fri 28 March 2025 |
416.98 (2.05%) |
408.60 |
408.00 - 417.00 |
0.5294 times |
Fri 28 February 2025 |
408.60 (-0.52%) |
410.70 |
407.55 - 412.00 |
1.4641 times |
Fri 31 January 2025 |
410.75 (0.72%) |
413.94 |
406.15 - 413.95 |
1.6666 times |
Tue 31 December 2024 |
407.80 (-0.18%) |
408.20 |
403.15 - 413.98 |
1.5821 times |

DMA SMA EMA moving averages of Sec Re 79NHIT47_N3
DMA (daily moving average) of Sec Re 79NHIT47_N3
| DMA period | DMA value | | 5 day DMA | 420.5 | | 12 day DMA | 421.52 | | 20 day DMA | 423.46 | | 35 day DMA | 424.96 | | 50 day DMA | 424.71 | | 100 day DMA | 421.11 | | 150 day DMA | 418.18 | | 200 day DMA | 415.8 | EMA (exponential moving average) of Sec Re 79NHIT47_N3
| EMA period | EMA current | EMA prev | EMA prev2 | | 5 day EMA | 422.04 | 420.7 | 419.62 | | 12 day EMA | 422.07 | 421.59 | 421.36 | | 20 day EMA | 422.89 | 422.7 | 422.68 | | 35 day EMA | 423.41 | 423.33 | 423.36 | | 50 day EMA | 423.96 | 423.93 | 423.97 |
SMA (simple moving average) of Sec Re 79NHIT47_N3
| SMA period | SMA current | SMA prev | SMA prev2 | | 5 day SMA | 420.5 | 419.45 | 418.9 | | 12 day SMA | 421.52 | 421.65 | 422.57 | | 20 day SMA | 423.46 | 423.5 | 423.67 | | 35 day SMA | 424.96 | 424.84 | 424.65 | | 50 day SMA | 424.71 | 424.61 | 424.55 | | 100 day SMA | 421.11 | 420.99 | 420.88 | | 150 day SMA | 418.18 | 418.08 | 418 | | 200 day SMA | 415.8 | 415.71 | 415.63 |
|
|
