GoiLoan 772GS2055_GS full analysis,charts,indicators,moving averages,SMA,DMA,EMA,ADX,MACD,RSIGoi Loan 772GS2055_GS WideScreen charts, DMA,SMA,EMA technical analysis, forecast prediction, by indicators ADX,MACD,RSI,CCI NSE stock exchange
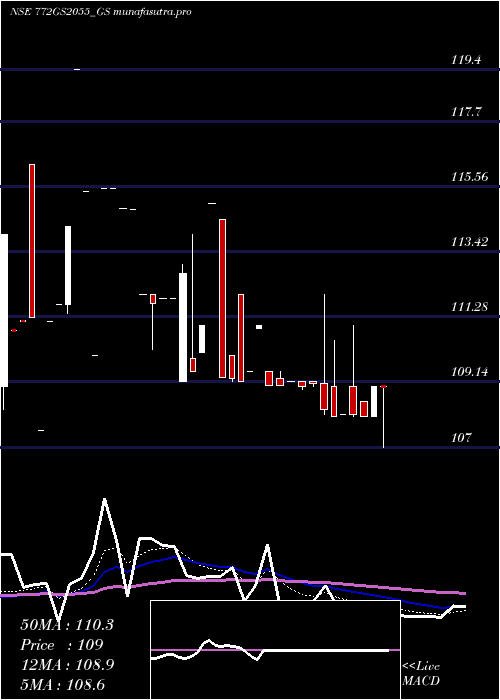
Daily price and charts and targets GoiLoan Strong Daily Stock price targets for GoiLoan 772GS2055_GS are 106.5 and 106.5 | Daily Target 1 | 106.5 | | Daily Target 2 | 106.5 | | Daily Target 3 | 106.5 | | Daily Target 4 | 106.5 | | Daily Target 5 | 106.5 |
Daily price and volume Goi Loan
| Date |
Closing |
Open |
Range |
Volume |
Tue 28 October 2025 |
106.50 (-2.08%) |
106.50 |
106.50 - 106.50 |
1.1261 times |
Fri 24 October 2025 |
108.76 (-5%) |
108.77 |
108.76 - 108.77 |
4.2348 times |
Thu 23 October 2025 |
114.49 (2.5%) |
114.49 |
114.49 - 114.49 |
0.0096 times |
Mon 20 October 2025 |
111.70 (-5%) |
111.70 |
111.70 - 111.70 |
0.0962 times |
Thu 09 October 2025 |
117.58 (4.99%) |
117.58 |
117.58 - 117.58 |
0.0962 times |
Fri 03 October 2025 |
111.99 (0.62%) |
111.99 |
111.99 - 111.99 |
0.0674 times |
Mon 29 September 2025 |
111.30 (5%) |
111.30 |
111.30 - 111.30 |
0.0577 times |
Fri 26 September 2025 |
106.00 (-4.07%) |
106.00 |
106.00 - 106.00 |
0.3754 times |
Wed 24 September 2025 |
110.50 (-0.71%) |
110.50 |
110.50 - 110.50 |
3.8499 times |
Wed 17 September 2025 |
111.29 (4.99%) |
111.29 |
111.29 - 111.29 |
0.0866 times |
Mon 15 September 2025 |
106.00 (0.52%) |
102.81 |
102.81 - 106.00 |
0.9721 times |
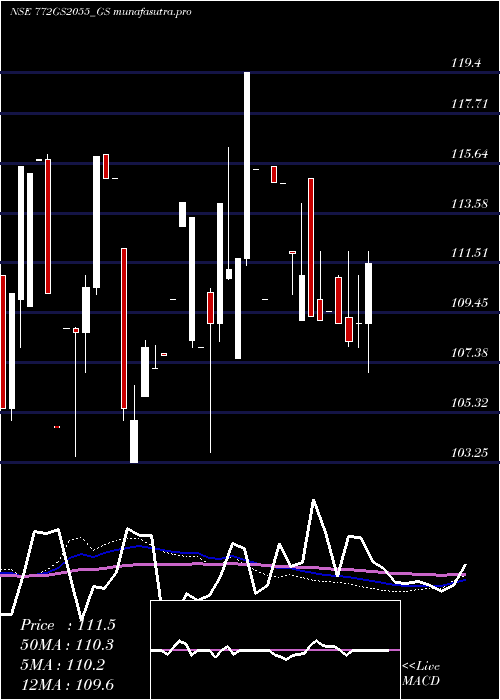
Weekly price and charts GoiLoan Strong weekly Stock price targets for GoiLoan 772GS2055_GS are 106.5 and 106.5 | Weekly Target 1 | 106.5 | | Weekly Target 2 | 106.5 | | Weekly Target 3 | 106.5 | | Weekly Target 4 | 106.5 | | Weekly Target 5 | 106.5 |
Weekly price and volumes for Goi Loan
| Date |
Closing |
Open |
Range |
Volume |
Tue 28 October 2025 |
106.50 (-2.08%) |
106.50 |
106.50 - 106.50 |
0.1118 times |
Fri 24 October 2025 |
108.76 (-7.5%) |
111.70 |
108.76 - 114.49 |
0.4308 times |
Thu 09 October 2025 |
117.58 (4.99%) |
117.58 |
117.58 - 117.58 |
0.0096 times |
Fri 03 October 2025 |
111.99 (5.65%) |
111.30 |
111.30 - 111.99 |
0.0124 times |
Fri 26 September 2025 |
106.00 (-4.75%) |
110.50 |
106.00 - 110.50 |
0.4193 times |
Wed 17 September 2025 |
111.29 (5.54%) |
102.81 |
102.81 - 111.29 |
0.1051 times |
Fri 05 September 2025 |
105.45 (-2.37%) |
107.00 |
105.44 - 110.99 |
2.5208 times |
Tue 12 August 2025 |
108.01 (-1.81%) |
109.60 |
108.00 - 109.60 |
2.5494 times |
Thu 07 August 2025 |
110.00 (0%) |
108.75 |
108.01 - 110.00 |
1.7595 times |
Fri 01 August 2025 |
110.00 (-0.9%) |
111.00 |
106.25 - 111.00 |
2.0814 times |
Fri 25 July 2025 |
111.00 (0.91%) |
110.00 |
109.00 - 111.00 |
3.9421 times |
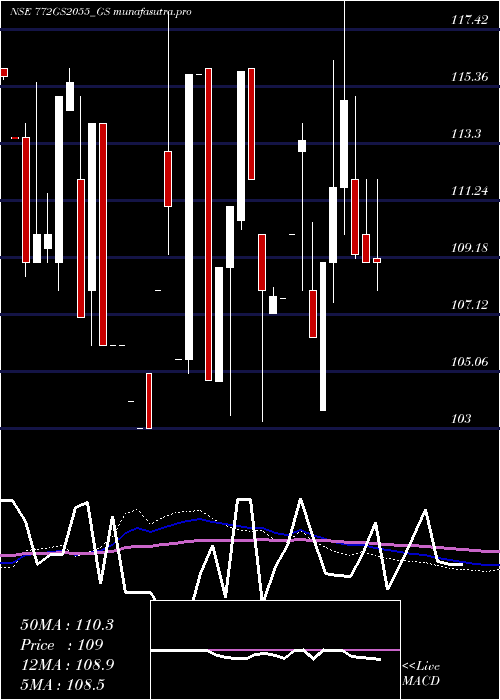
Monthly price and charts GoiLoan Strong monthly Stock price targets for GoiLoan 772GS2055_GS are 100.96 and 112.04 | Monthly Target 1 | 99.11 | | Monthly Target 2 | 102.81 | | Monthly Target 3 | 110.19333333333 | | Monthly Target 4 | 113.89 | | Monthly Target 5 | 121.27 |
Monthly price and volumes Goi Loan
| Date |
Closing |
Open |
Range |
Volume |
Tue 28 October 2025 |
106.50 (-4.31%) |
111.99 |
106.50 - 117.58 |
0.1334 times |
Mon 29 September 2025 |
111.30 (0.28%) |
110.96 |
102.81 - 111.30 |
0.2555 times |
Mon 18 August 2025 |
110.99 (0.58%) |
111.00 |
107.00 - 111.00 |
1.5357 times |
Thu 31 July 2025 |
110.35 (1.23%) |
109.15 |
106.25 - 112.00 |
5.1996 times |
Mon 30 June 2025 |
109.01 (-0.25%) |
110.00 |
109.01 - 112.00 |
0.6248 times |
Thu 22 May 2025 |
109.28 (-4.82%) |
112.00 |
109.15 - 115.00 |
1.3162 times |
Mon 28 April 2025 |
114.82 (2.8%) |
111.69 |
110.01 - 119.40 |
0.2295 times |
Fri 28 March 2025 |
111.69 (2.47%) |
109.00 |
107.55 - 116.28 |
0.483 times |
Fri 24 January 2025 |
109.00 (2.54%) |
103.65 |
103.65 - 109.00 |
0.0752 times |
Tue 31 December 2024 |
106.30 (-6.26%) |
108.00 |
106.29 - 110.45 |
0.147 times |
Thu 14 November 2024 |
113.40 (3.09%) |
113.00 |
108.00 - 114.00 |
1.1104 times |
DMA SMA EMA moving averages of Goi Loan 772GS2055_GS
DMA (daily moving average) of Goi Loan 772GS2055_GS
| DMA period | DMA value | | 5 day DMA | 111.81 | | 12 day DMA | 110.13 | | 20 day DMA | 109.53 | | 35 day DMA | 109.69 | | 50 day DMA | 109.66 | | 100 day DMA | 110.31 | | 150 day DMA | 110.39 | | 200 day DMA | 110.66 | EMA (exponential moving average) of Goi Loan 772GS2055_GS
| EMA period | EMA current | EMA prev | EMA prev2 | | 5 day EMA | 109.89 | 111.59 | 113.01 | | 12 day EMA | 110.21 | 110.89 | 111.28 | | 20 day EMA | 110.03 | 110.4 | 110.57 | | 35 day EMA | 109.88 | 110.08 | 110.16 | | 50 day EMA | 109.99 | 110.13 | 110.19 |
SMA (simple moving average) of Goi Loan 772GS2055_GS
| SMA period | SMA current | SMA prev | SMA prev2 | | 5 day SMA | 111.81 | 112.9 | 113.41 | | 12 day SMA | 110.13 | 110.04 | 109.77 | | 20 day SMA | 109.53 | 109.7 | 109.81 | | 35 day SMA | 109.69 | 109.73 | 109.71 | | 50 day SMA | 109.66 | 109.72 | 109.8 | | 100 day SMA | 110.31 | 110.4 | 110.47 | | 150 day SMA | 110.39 | 110.43 | 110.47 | | 200 day SMA | 110.66 | 110.68 | 110.7 |
|
|
