GoiLoan 772GS2049_GS full analysis,charts,indicators,moving averages,SMA,DMA,EMA,ADX,MACD,RSIGoi Loan 772GS2049_GS WideScreen charts, DMA,SMA,EMA technical analysis, forecast prediction, by indicators ADX,MACD,RSI,CCI NSE stock exchange
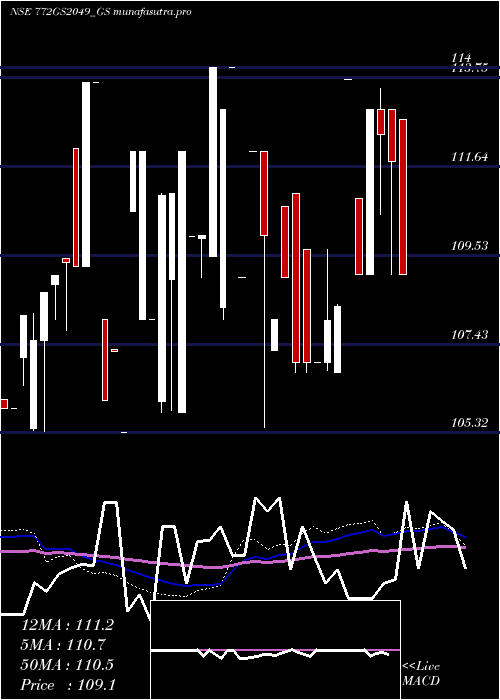
Daily price and charts and targets GoiLoan Strong Daily Stock price targets for GoiLoan 772GS2049_GS are 107.04 and 108.01 | Daily Target 1 | 106.39 | | Daily Target 2 | 106.71 | | Daily Target 3 | 107.35666666667 | | Daily Target 4 | 107.68 | | Daily Target 5 | 108.33 |
Daily price and volume Goi Loan
| Date |
Closing |
Open |
Range |
Volume |
Tue 09 December 2025 |
107.04 (-0.89%) |
107.03 |
107.03 - 108.00 |
0.2077 times |
Thu 04 December 2025 |
108.00 (1.88%) |
107.03 |
107.03 - 108.00 |
9.5896 times |
Wed 03 December 2025 |
106.01 (-3.85%) |
107.03 |
106.01 - 107.03 |
0.0003 times |
Tue 02 December 2025 |
110.26 (5%) |
110.26 |
110.26 - 110.26 |
0.1923 times |
Mon 01 December 2025 |
105.01 (-0.79%) |
107.03 |
105.01 - 107.03 |
0.0003 times |
Mon 24 November 2025 |
105.85 (0%) |
105.85 |
105.85 - 105.85 |
0.0011 times |
Thu 13 November 2025 |
105.85 (0%) |
107.09 |
105.85 - 107.09 |
0.005 times |
Wed 12 November 2025 |
105.85 (0%) |
105.85 |
105.85 - 105.85 |
0.0012 times |
Fri 31 October 2025 |
105.85 (2.57%) |
105.85 |
105.85 - 105.85 |
0.0002 times |
Thu 30 October 2025 |
103.20 (-2.5%) |
105.85 |
103.20 - 105.85 |
0.0023 times |
Thu 16 October 2025 |
105.85 (0%) |
105.85 |
105.85 - 105.85 |
0.0006 times |

Weekly price and charts GoiLoan Strong weekly Stock price targets for GoiLoan 772GS2049_GS are 107.04 and 108.01 | Weekly Target 1 | 106.39 | | Weekly Target 2 | 106.71 | | Weekly Target 3 | 107.35666666667 | | Weekly Target 4 | 107.68 | | Weekly Target 5 | 108.33 |
Weekly price and volumes for Goi Loan
| Date |
Closing |
Open |
Range |
Volume |
Tue 09 December 2025 |
107.04 (-0.89%) |
107.03 |
107.03 - 108.00 |
0.2005 times |
Thu 04 December 2025 |
108.00 (2.03%) |
107.03 |
105.01 - 110.26 |
9.4435 times |
Mon 24 November 2025 |
105.85 (0%) |
105.85 |
105.85 - 105.85 |
0.0011 times |
Thu 13 November 2025 |
105.85 (0%) |
105.85 |
105.85 - 107.09 |
0.006 times |
Fri 31 October 2025 |
105.85 (0%) |
105.85 |
103.20 - 105.85 |
0.0024 times |
Thu 16 October 2025 |
105.85 (-1.07%) |
105.85 |
105.85 - 105.85 |
0.0154 times |
Wed 08 October 2025 |
107.00 (-0.93%) |
105.30 |
105.30 - 107.00 |
0.0017 times |
Thu 18 September 2025 |
108.00 (0%) |
108.00 |
108.00 - 108.60 |
0.1492 times |
Wed 10 September 2025 |
108.00 (2.6%) |
107.52 |
104.60 - 108.01 |
0.1779 times |
Wed 13 August 2025 |
105.26 (-0.94%) |
105.25 |
105.25 - 105.26 |
0.0024 times |
Thu 17 July 2025 |
106.26 (-3.62%) |
106.25 |
106.25 - 106.26 |
0.0015 times |
Monthly price and charts GoiLoan Strong monthly Stock price targets for GoiLoan 772GS2049_GS are 106.03 and 111.28 | Monthly Target 1 | 102.19 | | Monthly Target 2 | 104.61 | | Monthly Target 3 | 107.43666666667 | | Monthly Target 4 | 109.86 | | Monthly Target 5 | 112.69 |
Monthly price and volumes Goi Loan
| Date |
Closing |
Open |
Range |
Volume |
Tue 09 December 2025 |
107.04 (1.12%) |
107.03 |
105.01 - 110.26 |
7.3191 times |
Mon 24 November 2025 |
105.85 (0%) |
105.85 |
105.85 - 107.09 |
0.0054 times |
Fri 31 October 2025 |
105.85 (0.52%) |
107.00 |
103.20 - 107.00 |
0.0139 times |
Mon 22 September 2025 |
105.30 (-2.06%) |
108.01 |
104.60 - 108.60 |
0.2481 times |
Mon 18 August 2025 |
107.52 (1.19%) |
105.25 |
105.25 - 107.52 |
0.0027 times |
Thu 17 July 2025 |
106.26 (0.72%) |
108.50 |
106.25 - 110.25 |
0.118 times |
Wed 25 June 2025 |
105.50 (-5.8%) |
109.07 |
103.85 - 115.25 |
0.1913 times |
Fri 30 May 2025 |
112.00 (1.22%) |
109.07 |
109.07 - 113.50 |
1.4558 times |
Wed 30 April 2025 |
110.65 (2.16%) |
113.72 |
109.07 - 113.72 |
0.579 times |
Tue 25 March 2025 |
108.31 (1.22%) |
107.00 |
106.75 - 109.68 |
0.0666 times |
Thu 27 February 2025 |
107.00 (-1.84%) |
111.00 |
106.75 - 111.00 |
0.8229 times |
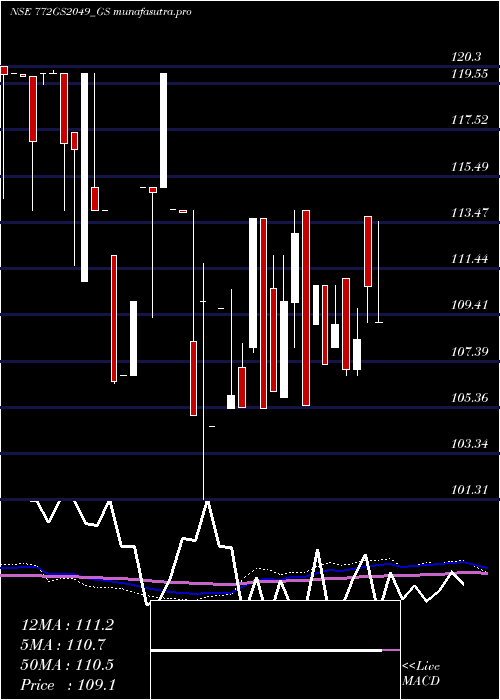
DMA SMA EMA moving averages of Goi Loan 772GS2049_GS
DMA (daily moving average) of Goi Loan 772GS2049_GS
| DMA period | DMA value | | 5 day DMA | 107.26 | | 12 day DMA | 106.22 | | 20 day DMA | 106.62 | | 35 day DMA | 108.32 | | 50 day DMA | 109.41 | | 100 day DMA | 109.46 | | 150 day DMA | 109.35 | | 200 day DMA | 110.89 | EMA (exponential moving average) of Goi Loan 772GS2049_GS
| EMA period | EMA current | EMA prev | EMA prev2 | | 5 day EMA | 107.11 | 107.15 | 106.73 | | 12 day EMA | 106.85 | 106.82 | 106.6 | | 20 day EMA | 107.15 | 107.16 | 107.07 | | 35 day EMA | 108.09 | 108.15 | 108.16 | | 50 day EMA | 109.35 | 109.44 | 109.5 |
SMA (simple moving average) of Goi Loan 772GS2049_GS
| SMA period | SMA current | SMA prev | SMA prev2 | | 5 day SMA | 107.26 | 107.03 | 106.6 | | 12 day SMA | 106.22 | 106.22 | 105.99 | | 20 day SMA | 106.62 | 106.58 | 106.69 | | 35 day SMA | 108.32 | 108.47 | 108.6 | | 50 day SMA | 109.41 | 109.45 | 109.51 | | 100 day SMA | 109.46 | 109.51 | 109.55 | | 150 day SMA | 109.35 | 109.4 | 109.48 | | 200 day SMA | 110.89 | 110.95 | 111.01 |
|
|
