TaxFree 769NHAI31_NE full analysis,charts,indicators,moving averages,SMA,DMA,EMA,ADX,MACD,RSITax Free 769NHAI31_NE WideScreen charts, DMA,SMA,EMA technical analysis, forecast prediction, by indicators ADX,MACD,RSI,CCI NSE stock exchange
Daily price and charts and targets TaxFree Strong Daily Stock price targets for TaxFree 769NHAI31_NE are 1102.15 and 1104.85 | Daily Target 1 | 1099.9 | | Daily Target 2 | 1101.69 | | Daily Target 3 | 1102.5966666667 | | Daily Target 4 | 1104.39 | | Daily Target 5 | 1105.3 |
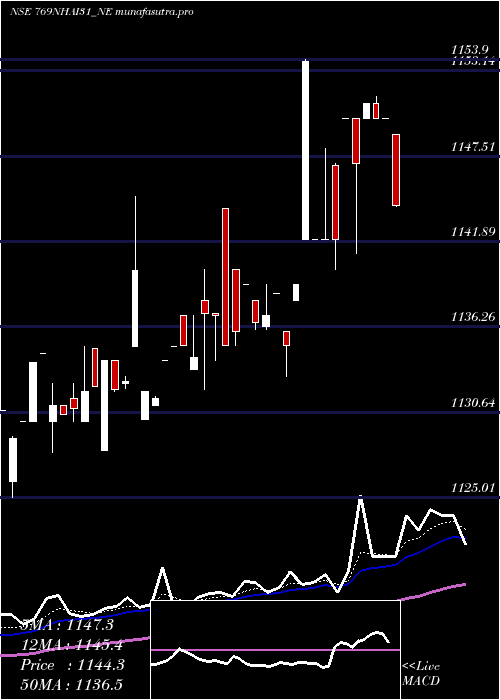
Daily price and volume Tax Free
| Date |
Closing |
Open |
Range |
Volume |
Tue 28 October 2025 |
1103.49 (0.55%) |
1100.80 |
1100.80 - 1103.50 |
0.7137 times |
Mon 27 October 2025 |
1097.40 (-0.28%) |
1100.44 |
1097.40 - 1100.44 |
0.1747 times |
Fri 24 October 2025 |
1100.44 (-0.37%) |
1104.60 |
1096.00 - 1104.60 |
2.5629 times |
Thu 23 October 2025 |
1104.50 (0.19%) |
1100.10 |
1099.85 - 1104.50 |
0.4984 times |
Tue 21 October 2025 |
1102.39 (0.04%) |
1104.90 |
1101.95 - 1104.90 |
0.393 times |
Mon 20 October 2025 |
1101.90 (0.04%) |
1102.00 |
1101.90 - 1102.00 |
0.1762 times |
Fri 17 October 2025 |
1101.45 (-0.09%) |
1102.00 |
1101.00 - 1102.00 |
0.256 times |
Thu 16 October 2025 |
1102.49 (0.67%) |
1099.80 |
1096.25 - 1103.20 |
2.4544 times |
Wed 15 October 2025 |
1095.10 (-0.1%) |
1097.11 |
1095.10 - 1097.11 |
2.6653 times |
Tue 14 October 2025 |
1096.25 (-0.22%) |
1098.99 |
1096.25 - 1098.99 |
0.1054 times |
Mon 13 October 2025 |
1098.66 (-0.1%) |
1099.50 |
1098.00 - 1099.50 |
0.4156 times |
Weekly price and charts TaxFree Strong weekly Stock price targets for TaxFree 769NHAI31_NE are 1100.45 and 1106.55 | Weekly Target 1 | 1095.36 | | Weekly Target 2 | 1099.43 | | Weekly Target 3 | 1101.4633333333 | | Weekly Target 4 | 1105.53 | | Weekly Target 5 | 1107.56 |
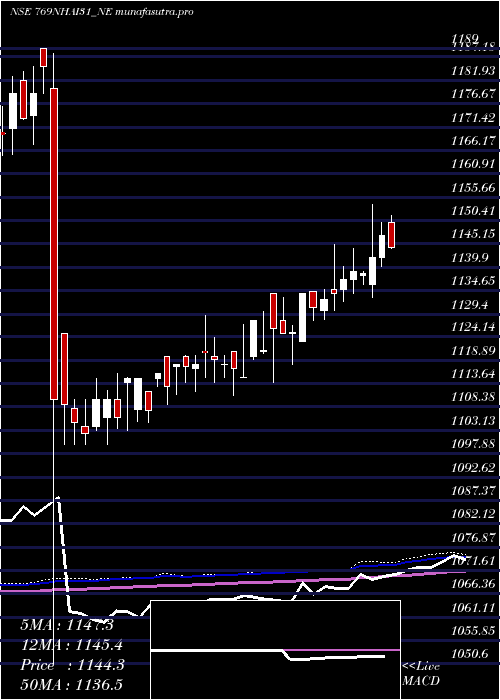
Weekly price and volumes for Tax Free
| Date |
Closing |
Open |
Range |
Volume |
Tue 28 October 2025 |
1103.49 (0.28%) |
1100.44 |
1097.40 - 1103.50 |
0.1237 times |
Fri 24 October 2025 |
1100.44 (-0.09%) |
1102.00 |
1096.00 - 1104.90 |
0.5054 times |
Fri 17 October 2025 |
1101.45 (0.15%) |
1099.50 |
1095.10 - 1103.20 |
0.8208 times |
Fri 10 October 2025 |
1099.80 (0.62%) |
1093.00 |
1092.55 - 1099.80 |
1.1283 times |
Fri 03 October 2025 |
1093.00 (-0.28%) |
1095.11 |
1089.11 - 1099.90 |
2.4296 times |
Fri 26 September 2025 |
1096.05 (0.44%) |
1096.00 |
1090.10 - 1103.00 |
1.4377 times |
Fri 19 September 2025 |
1091.22 (-6.27%) |
1168.99 |
1091.10 - 1168.99 |
2.2665 times |
Fri 12 September 2025 |
1164.16 (-0.5%) |
1165.01 |
1164.16 - 1170.00 |
0.4473 times |
Fri 05 September 2025 |
1169.96 (0.35%) |
1167.00 |
1164.00 - 1170.00 |
0.554 times |
Fri 29 August 2025 |
1165.89 (0.12%) |
1164.50 |
1160.31 - 1165.90 |
0.2865 times |
Fri 22 August 2025 |
1164.50 (0.39%) |
1161.00 |
1159.90 - 1167.95 |
0.8686 times |
Monthly price and charts TaxFree Strong monthly Stock price targets for TaxFree 769NHAI31_NE are 1096.3 and 1112.09 | Monthly Target 1 | 1083.38 | | Monthly Target 2 | 1093.43 | | Monthly Target 3 | 1099.1666666667 | | Monthly Target 4 | 1109.22 | | Monthly Target 5 | 1114.96 |
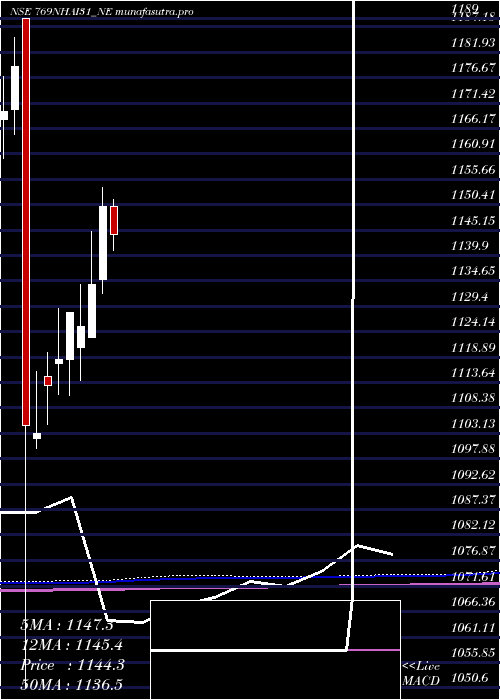
Monthly price and volumes Tax Free
| Date |
Closing |
Open |
Range |
Volume |
Tue 28 October 2025 |
1103.49 (0.73%) |
1092.05 |
1089.11 - 1104.90 |
1.1339 times |
Tue 30 September 2025 |
1095.50 (-6.04%) |
1167.00 |
1090.10 - 1170.00 |
1.2246 times |
Fri 29 August 2025 |
1165.89 (0.66%) |
1158.30 |
1157.20 - 1167.95 |
0.6183 times |
Thu 31 July 2025 |
1158.30 (0.48%) |
1152.40 |
1150.00 - 1169.00 |
1.0007 times |
Mon 30 June 2025 |
1152.82 (-1.48%) |
1187.00 |
1150.00 - 1189.00 |
1.0696 times |
Fri 30 May 2025 |
1170.15 (1.75%) |
1150.00 |
1141.10 - 1210.00 |
1.2234 times |
Wed 30 April 2025 |
1150.00 (1.41%) |
1134.95 |
1132.10 - 1153.90 |
0.7219 times |
Fri 28 March 2025 |
1134.00 (0.79%) |
1123.00 |
1123.00 - 1144.90 |
1.5277 times |
Fri 28 February 2025 |
1125.15 (-0.25%) |
1121.00 |
1114.00 - 1134.00 |
0.7212 times |
Fri 31 January 2025 |
1127.99 (0.85%) |
1118.40 |
1111.01 - 1127.99 |
0.7588 times |
Tue 31 December 2024 |
1118.50 (0.49%) |
1117.50 |
1111.10 - 1129.00 |
0.6989 times |
DMA SMA EMA moving averages of Tax Free 769NHAI31_NE
DMA (daily moving average) of Tax Free 769NHAI31_NE
| DMA period | DMA value | | 5 day DMA | 1101.64 | | 12 day DMA | 1100.32 | | 20 day DMA | 1098.24 | | 35 day DMA | 1109.41 | | 50 day DMA | 1125.63 | | 100 day DMA | 1143 | | 150 day DMA | 1144.47 | | 200 day DMA | 1139.17 | EMA (exponential moving average) of Tax Free 769NHAI31_NE
| EMA period | EMA current | EMA prev | EMA prev2 | | 5 day EMA | 1101.29 | 1100.19 | 1101.58 | | 12 day EMA | 1100.76 | 1100.26 | 1100.78 | | 20 day EMA | 1102.95 | 1102.89 | 1103.47 | | 35 day EMA | 1114.2 | 1114.83 | 1115.86 | | 50 day EMA | 1126.25 | 1127.18 | 1128.39 |
SMA (simple moving average) of Tax Free 769NHAI31_NE
| SMA period | SMA current | SMA prev | SMA prev2 | | 5 day SMA | 1101.64 | 1101.33 | 1102.14 | | 12 day SMA | 1100.32 | 1099.63 | 1099.6 | | 20 day SMA | 1098.24 | 1097.87 | 1098.13 | | 35 day SMA | 1109.41 | 1111.31 | 1113.21 | | 50 day SMA | 1125.63 | 1126.76 | 1128.09 | | 100 day SMA | 1143 | 1143.66 | 1144.36 | | 150 day SMA | 1144.47 | 1144.66 | 1144.88 | | 200 day SMA | 1139.17 | 1139.24 | 1139.34 |
|
|
