SecRe 769IGT28_NH full analysis,charts,indicators,moving averages,SMA,DMA,EMA,ADX,MACD,RSISec Re 769IGT28_NH WideScreen charts, DMA,SMA,EMA technical analysis, forecast prediction, by indicators ADX,MACD,RSI,CCI NSE stock exchange
Daily price and charts and targets SecRe Strong Daily Stock price targets for SecRe 769IGT28_NH are 890 and 890 | Daily Target 1 | 890 | | Daily Target 2 | 890 | | Daily Target 3 | 890 | | Daily Target 4 | 890 | | Daily Target 5 | 890 |
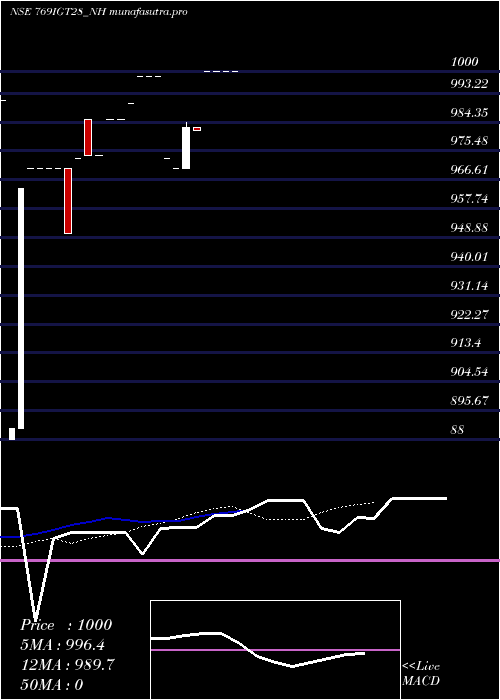
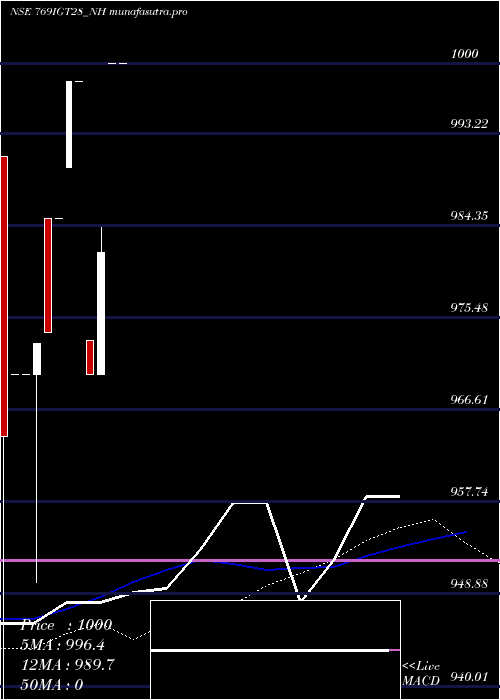
Daily price and volume Sec Re
| Date |
Closing |
Open |
Range |
Volume |
Tue 02 September 2025 |
890.00 (-11.09%) |
890.00 |
890.00 - 890.00 |
4.2608 times |
Wed 20 August 2025 |
1001.00 (0%) |
1001.00 |
1001.00 - 1001.00 |
0.0085 times |
Tue 29 July 2025 |
1001.00 (0.1%) |
1000.00 |
1000.00 - 1001.00 |
0.5411 times |
Thu 24 July 2025 |
1000.01 (0%) |
1000.00 |
1000.00 - 1000.01 |
0.6817 times |
Wed 23 July 2025 |
1000.00 (-0.22%) |
1000.00 |
1000.00 - 1000.00 |
0.4261 times |
Wed 16 July 2025 |
1002.16 (-0.18%) |
1004.48 |
1002.16 - 1004.48 |
0.4261 times |
Thu 03 July 2025 |
1004.00 (0%) |
1004.01 |
1004.00 - 1004.01 |
0.4261 times |
Wed 02 July 2025 |
1003.99 (0.4%) |
990.00 |
990.00 - 1003.99 |
2.5905 times |
Mon 02 June 2025 |
1000.00 (2.56%) |
999.00 |
999.00 - 1000.00 |
0.4687 times |
Wed 21 May 2025 |
975.00 (-2.5%) |
975.00 |
975.00 - 975.00 |
0.1704 times |
Thu 17 April 2025 |
1000.00 (0%) |
1000.00 |
1000.00 - 1000.00 |
0.0852 times |
Weekly price and charts SecRe Strong weekly Stock price targets for SecRe 769IGT28_NH are 890 and 890 | Weekly Target 1 | 890 | | Weekly Target 2 | 890 | | Weekly Target 3 | 890 | | Weekly Target 4 | 890 | | Weekly Target 5 | 890 |
Weekly price and volumes for Sec Re
| Date |
Closing |
Open |
Range |
Volume |
Tue 02 September 2025 |
890.00 (-11.09%) |
890.00 |
890.00 - 890.00 |
2.6954 times |
Wed 20 August 2025 |
1001.00 (0.1%) |
1000.00 |
1000.00 - 1001.00 |
0.3477 times |
Thu 24 July 2025 |
1000.01 (-0.21%) |
1000.00 |
1000.00 - 1000.01 |
0.7008 times |
Wed 16 July 2025 |
1002.16 (-0.18%) |
1004.48 |
1002.16 - 1004.48 |
0.2695 times |
Thu 03 July 2025 |
1004.00 (2.97%) |
999.00 |
990.00 - 1004.01 |
2.2049 times |
Wed 21 May 2025 |
975.00 (-2.5%) |
975.00 |
975.00 - 975.00 |
0.1078 times |
Thu 17 April 2025 |
1000.00 (0%) |
1000.00 |
1000.00 - 1000.00 |
0.1779 times |
Tue 08 April 2025 |
1000.00 (1.85%) |
1000.00 |
1000.00 - 1000.00 |
0.1482 times |
Wed 02 April 2025 |
981.81 (1.22%) |
970.00 |
970.00 - 984.20 |
3.248 times |
Thu 13 February 2025 |
970.00 (-2.83%) |
973.25 |
970.00 - 973.25 |
0.0997 times |
Thu 02 January 2025 |
998.20 (-0%) |
998.20 |
998.20 - 998.20 |
0.1348 times |
Monthly price and charts SecRe Strong monthly Stock price targets for SecRe 769IGT28_NH are 890 and 890 | Monthly Target 1 | 890 | | Monthly Target 2 | 890 | | Monthly Target 3 | 890 | | Monthly Target 4 | 890 | | Monthly Target 5 | 890 |
Monthly price and volumes Sec Re
| Date |
Closing |
Open |
Range |
Volume |
Tue 02 September 2025 |
890.00 (-11.09%) |
890.00 |
890.00 - 890.00 |
2.1877 times |
Wed 20 August 2025 |
1001.00 (0%) |
1001.00 |
1001.00 - 1001.00 |
0.0044 times |
Tue 29 July 2025 |
1001.00 (0.1%) |
990.00 |
990.00 - 1004.48 |
2.6143 times |
Mon 02 June 2025 |
1000.00 (2.56%) |
999.00 |
999.00 - 1000.00 |
0.2406 times |
Wed 21 May 2025 |
975.00 (-2.5%) |
975.00 |
975.00 - 975.00 |
0.0875 times |
Thu 17 April 2025 |
1000.00 (1.75%) |
982.81 |
981.81 - 1000.00 |
2.0477 times |
Mon 10 March 2025 |
982.81 (1.32%) |
970.00 |
970.00 - 984.20 |
0.8532 times |
Thu 13 February 2025 |
970.00 (-0.33%) |
970.00 |
970.00 - 970.00 |
0.0438 times |
Wed 08 January 2025 |
973.25 (-2.5%) |
998.20 |
973.25 - 998.20 |
0.1356 times |
Mon 30 December 2024 |
998.20 (2.48%) |
985.00 |
985.00 - 998.21 |
1.7852 times |
Fri 29 November 2024 |
974.01 (0.41%) |
970.00 |
950.00 - 985.00 |
2.7128 times |

DMA SMA EMA moving averages of Sec Re 769IGT28_NH
DMA (daily moving average) of Sec Re 769IGT28_NH
| DMA period | DMA value | | 5 day DMA | 978.4 | | 12 day DMA | 989.76 | | 20 day DMA | 989.07 | | 35 day DMA | | | 50 day DMA | | | 100 day DMA | | | 150 day DMA | | | 200 day DMA | | EMA (exponential moving average) of Sec Re 769IGT28_NH
| EMA period | EMA current | EMA prev | EMA prev2 | | 5 day EMA | 963.72 | 1000.57 | 1000.36 | | 12 day EMA | 981.1 | 997.66 | 997.05 | | 20 day EMA | 982.98 | 992.76 | 991.89 | | 35 day EMA | 981.02 | | 50 day EMA | 0 | 0 | 0 |
SMA (simple moving average) of Sec Re 769IGT28_NH
| SMA period | SMA current | SMA prev | SMA prev2 | | 5 day SMA | 978.4 | 1000.83 | 1001.43 | | 12 day SMA | 989.76 | 998.93 | 998.85 | | 20 day SMA | 989.07 | 994.48 | 993.93 | | 35 day SMA | | 50 day SMA | | 100 day SMA | | 150 day SMA | | 200 day SMA |
|
|
