769 769HUDCO31_N9 full analysis,charts,indicators,moving averages,SMA,DMA,EMA,ADX,MACD,RSI7 69 769HUDCO31_N9 WideScreen charts, DMA,SMA,EMA technical analysis, forecast prediction, by indicators ADX,MACD,RSI,CCI NSE stock exchange
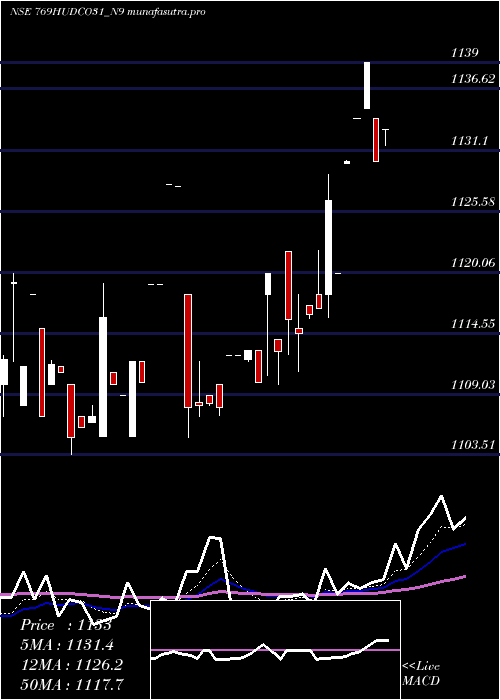
Daily price and charts and targets 769 Strong Daily Stock price targets for 769 769HUDCO31_N9 are 1093.7 and 1094.1 | Daily Target 1 | 1093.36 | | Daily Target 2 | 1093.63 | | Daily Target 3 | 1093.7633333333 | | Daily Target 4 | 1094.03 | | Daily Target 5 | 1094.16 |
Daily price and volume 7 69
| Date |
Closing |
Open |
Range |
Volume |
Tue 09 December 2025 |
1093.89 (0.08%) |
1093.50 |
1093.50 - 1093.90 |
0.3475 times |
Mon 08 December 2025 |
1093.00 (-0.04%) |
1093.00 |
1093.00 - 1094.00 |
0.6848 times |
Fri 05 December 2025 |
1093.45 (0.13%) |
1095.00 |
1093.00 - 1095.00 |
0.9744 times |
Thu 04 December 2025 |
1091.99 (0.15%) |
1091.99 |
1091.99 - 1091.99 |
0.2215 times |
Wed 03 December 2025 |
1090.33 (0.09%) |
1089.39 |
1089.39 - 1091.99 |
0.3782 times |
Tue 02 December 2025 |
1089.39 (-0.06%) |
1085.05 |
1083.01 - 1089.84 |
2.0477 times |
Mon 01 December 2025 |
1090.00 (-0.24%) |
1092.60 |
1090.00 - 1092.60 |
0.0409 times |
Fri 28 November 2025 |
1092.60 (0%) |
1092.60 |
1092.60 - 1092.60 |
0.3441 times |
Thu 27 November 2025 |
1092.60 (0.05%) |
1090.55 |
1090.55 - 1092.99 |
2.293 times |
Wed 26 November 2025 |
1092.00 (-6.88%) |
1086.00 |
1086.00 - 1094.99 |
2.6678 times |
Fri 21 November 2025 |
1172.68 (0.27%) |
1171.50 |
1171.50 - 1173.00 |
0.5963 times |
Weekly price and charts 769 Strong weekly Stock price targets for 769 769HUDCO31_N9 are 1093.45 and 1094.45 | Weekly Target 1 | 1092.63 | | Weekly Target 2 | 1093.26 | | Weekly Target 3 | 1093.63 | | Weekly Target 4 | 1094.26 | | Weekly Target 5 | 1094.63 |
Weekly price and volumes for 7 69
| Date |
Closing |
Open |
Range |
Volume |
Tue 09 December 2025 |
1093.89 (0.04%) |
1093.00 |
1093.00 - 1094.00 |
0.1537 times |
Fri 05 December 2025 |
1093.45 (0.08%) |
1092.60 |
1083.01 - 1095.00 |
0.5453 times |
Fri 28 November 2025 |
1092.60 (-6.83%) |
1086.00 |
1086.00 - 1094.99 |
0.7898 times |
Fri 21 November 2025 |
1172.68 (0.24%) |
1168.00 |
1163.20 - 1173.00 |
0.7121 times |
Fri 14 November 2025 |
1169.90 (0.59%) |
1160.00 |
1160.00 - 1170.00 |
0.1917 times |
Fri 07 November 2025 |
1163.00 (-0.04%) |
1163.00 |
1160.00 - 1167.00 |
0.5975 times |
Fri 31 October 2025 |
1163.50 (0.17%) |
1169.00 |
1156.21 - 1169.00 |
0.4677 times |
Thu 23 October 2025 |
1161.50 (0.47%) |
1161.25 |
1160.00 - 1161.50 |
0.4859 times |
Fri 17 October 2025 |
1156.10 (0.57%) |
1159.00 |
1152.00 - 1159.00 |
5.4684 times |
Fri 10 October 2025 |
1149.50 (0.04%) |
1153.80 |
1147.02 - 1153.80 |
0.5879 times |
Fri 03 October 2025 |
1149.00 (-0.28%) |
1148.10 |
1145.11 - 1151.89 |
1.122 times |
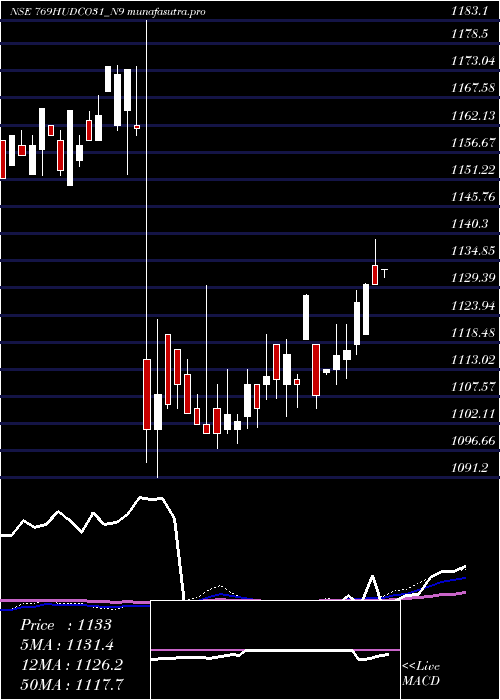
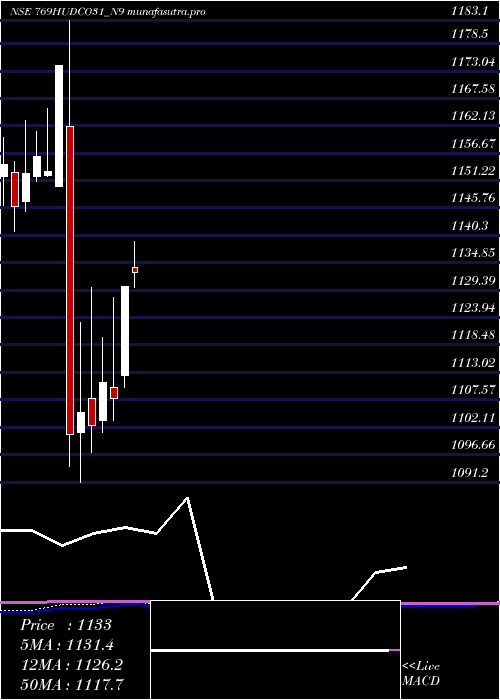
Monthly price and charts 769 Strong monthly Stock price targets for 769 769HUDCO31_N9 are 1088.45 and 1100.44 | Monthly Target 1 | 1078.64 | | Monthly Target 2 | 1086.27 | | Monthly Target 3 | 1090.6333333333 | | Monthly Target 4 | 1098.26 | | Monthly Target 5 | 1102.62 |
Monthly price and volumes 7 69
| Date |
Closing |
Open |
Range |
Volume |
Tue 09 December 2025 |
1093.89 (0.12%) |
1092.60 |
1083.01 - 1095.00 |
0.1873 times |
Fri 28 November 2025 |
1092.60 (-6.09%) |
1163.00 |
1086.00 - 1173.00 |
0.614 times |
Fri 31 October 2025 |
1163.50 (1.05%) |
1151.40 |
1147.02 - 1169.00 |
2.0664 times |
Tue 30 September 2025 |
1151.40 (1.18%) |
1145.00 |
1126.12 - 1158.00 |
1.0334 times |
Thu 28 August 2025 |
1138.00 (-0.17%) |
1140.00 |
1137.50 - 1149.39 |
1.2503 times |
Thu 31 July 2025 |
1139.90 (0.61%) |
1132.50 |
1132.50 - 1144.00 |
0.9515 times |
Mon 30 June 2025 |
1133.00 (-0.61%) |
1140.00 |
1128.00 - 1142.90 |
0.8874 times |
Fri 30 May 2025 |
1140.00 (0.88%) |
1133.99 |
1125.15 - 1142.00 |
0.7985 times |
Wed 30 April 2025 |
1130.10 (2.01%) |
1112.49 |
1110.00 - 1130.20 |
0.8426 times |
Fri 28 March 2025 |
1107.82 (-0.29%) |
1110.00 |
1103.51 - 1128.00 |
1.3685 times |
Fri 28 February 2025 |
1111.00 (0.77%) |
1103.50 |
1101.11 - 1120.00 |
0.7598 times |
DMA SMA EMA moving averages of 7 69 769HUDCO31_N9
DMA (daily moving average) of 7 69 769HUDCO31_N9
| DMA period | DMA value | | 5 day DMA | 1092.53 | | 12 day DMA | 1105.12 | | 20 day DMA | 1129.6 | | 35 day DMA | 1141.65 | | 50 day DMA | 1144.43 | | 100 day DMA | 1141.87 | | 150 day DMA | 1134.9 | | 200 day DMA | 1127.96 | EMA (exponential moving average) of 7 69 769HUDCO31_N9
| EMA period | EMA current | EMA prev | EMA prev2 | | 5 day EMA | 1094.15 | 1094.28 | 1094.92 | | 12 day EMA | 1106.32 | 1108.58 | 1111.41 | | 20 day EMA | 1118.62 | 1121.22 | 1124.19 | | 35 day EMA | 1130.09 | 1132.22 | 1134.53 | | 50 day EMA | 1139.41 | 1141.27 | 1143.24 |
SMA (simple moving average) of 7 69 769HUDCO31_N9
| SMA period | SMA current | SMA prev | SMA prev2 | | 5 day SMA | 1092.53 | 1091.63 | 1091.03 | | 12 day SMA | 1105.12 | 1111.42 | 1117.67 | | 20 day SMA | 1129.6 | 1133.05 | 1136.41 | | 35 day SMA | 1141.65 | 1143.23 | 1144.85 | | 50 day SMA | 1144.43 | 1145.47 | 1146.71 | | 100 day SMA | 1141.87 | 1142.26 | 1142.67 | | 150 day SMA | 1134.9 | 1135.06 | 1135.18 | | 200 day SMA | 1127.96 | 1127.99 | 1128.1 |
|
|
