GoiLoan 759GS2026_GS full analysis,charts,indicators,moving averages,SMA,DMA,EMA,ADX,MACD,RSIGoi Loan 759GS2026_GS WideScreen charts, DMA,SMA,EMA technical analysis, forecast prediction, by indicators ADX,MACD,RSI,CCI NSE stock exchange
Daily price and charts and targets GoiLoan Strong Daily Stock price targets for GoiLoan 759GS2026_GS are 102.5 and 102.5 | Daily Target 1 | 102.5 | | Daily Target 2 | 102.5 | | Daily Target 3 | 102.5 | | Daily Target 4 | 102.5 | | Daily Target 5 | 102.5 |
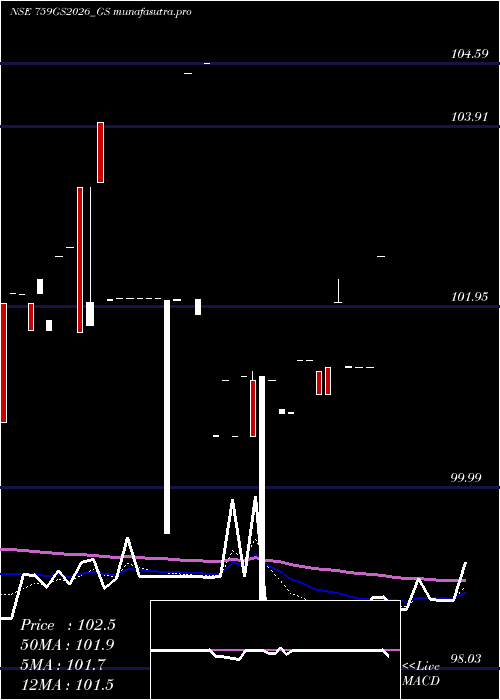
Daily price and volume Goi Loan
| Date |
Closing |
Open |
Range |
Volume |
Tue 28 October 2025 |
102.50 (1.18%) |
102.50 |
102.50 - 102.50 |
0.7622 times |
Fri 24 October 2025 |
101.30 (0%) |
101.30 |
101.30 - 101.30 |
1.9055 times |
Thu 23 October 2025 |
101.30 (-0.01%) |
101.30 |
101.30 - 101.30 |
1.1814 times |
Tue 14 October 2025 |
101.31 (-0.68%) |
101.30 |
101.30 - 101.31 |
0.0419 times |
Fri 10 October 2025 |
102.00 (0.99%) |
102.00 |
102.00 - 102.25 |
5.7165 times |
Wed 01 October 2025 |
101.00 (0%) |
101.30 |
101.00 - 101.30 |
0.0038 times |
Mon 22 September 2025 |
101.00 (-0.36%) |
101.25 |
101.00 - 101.25 |
0.0191 times |
Wed 03 September 2025 |
101.37 (0%) |
101.37 |
101.37 - 101.37 |
0.3258 times |
Tue 26 August 2025 |
101.37 (0.56%) |
101.37 |
101.37 - 101.37 |
0.0133 times |
Thu 21 August 2025 |
100.81 (-0.03%) |
100.80 |
100.80 - 100.81 |
0.0305 times |
Mon 11 August 2025 |
100.84 (-0.31%) |
100.80 |
100.80 - 100.84 |
0.061 times |
Weekly price and charts GoiLoan Strong weekly Stock price targets for GoiLoan 759GS2026_GS are 102.5 and 102.5 | Weekly Target 1 | 102.5 | | Weekly Target 2 | 102.5 | | Weekly Target 3 | 102.5 | | Weekly Target 4 | 102.5 | | Weekly Target 5 | 102.5 |
Weekly price and volumes for Goi Loan
| Date |
Closing |
Open |
Range |
Volume |
Tue 28 October 2025 |
102.50 (1.18%) |
102.50 |
102.50 - 102.50 |
0.6016 times |
Fri 24 October 2025 |
101.30 (-0.69%) |
101.30 |
101.30 - 101.31 |
2.4695 times |
Fri 10 October 2025 |
102.00 (0.62%) |
101.25 |
101.00 - 102.25 |
4.53 times |
Wed 03 September 2025 |
101.37 (0.56%) |
101.37 |
101.37 - 101.37 |
0.2677 times |
Thu 21 August 2025 |
100.81 (-0.34%) |
100.80 |
100.80 - 100.84 |
0.0722 times |
Thu 31 July 2025 |
101.15 (0.6%) |
101.20 |
98.03 - 101.25 |
1.0378 times |
Thu 24 July 2025 |
100.55 (-0.01%) |
101.15 |
100.55 - 101.15 |
0.0135 times |
Wed 09 July 2025 |
100.56 (-3.85%) |
100.55 |
100.55 - 100.56 |
0.009 times |
Fri 04 July 2025 |
104.59 (0.1%) |
101.87 |
101.87 - 104.59 |
0.0045 times |
Wed 11 June 2025 |
104.49 (2.39%) |
99.49 |
99.49 - 104.49 |
0.9941 times |
Fri 06 June 2025 |
102.05 (0%) |
102.05 |
102.05 - 102.05 |
0.1549 times |

Monthly price and charts GoiLoan Strong monthly Stock price targets for GoiLoan 759GS2026_GS are 101.75 and 103.25 | Monthly Target 1 | 100.5 | | Monthly Target 2 | 101.5 | | Monthly Target 3 | 102 | | Monthly Target 4 | 103 | | Monthly Target 5 | 103.5 |
Monthly price and volumes Goi Loan
| Date |
Closing |
Open |
Range |
Volume |
Tue 28 October 2025 |
102.50 (1.49%) |
101.30 |
101.00 - 102.50 |
2.7471 times |
Mon 22 September 2025 |
101.00 (-0.36%) |
101.37 |
101.00 - 101.37 |
0.0986 times |
Tue 26 August 2025 |
101.37 (0.22%) |
100.80 |
100.80 - 101.37 |
0.03 times |
Thu 31 July 2025 |
101.15 (-0.87%) |
104.59 |
98.03 - 104.59 |
0.3845 times |
Mon 16 June 2025 |
102.04 (-0.01%) |
102.05 |
99.49 - 104.49 |
0.4166 times |
Wed 21 May 2025 |
102.05 (0.01%) |
102.05 |
102.05 - 102.05 |
0.2549 times |
Thu 24 April 2025 |
102.04 (0.24%) |
102.50 |
101.68 - 103.95 |
1.4013 times |
Wed 26 March 2025 |
101.80 (0.49%) |
100.70 |
100.70 - 102.25 |
0.1634 times |
Fri 28 February 2025 |
101.30 (-0.39%) |
100.70 |
100.70 - 105.00 |
4.289 times |
Fri 31 January 2025 |
101.70 (-1.79%) |
100.97 |
100.70 - 103.00 |
0.2146 times |
Mon 30 December 2024 |
103.55 (0.97%) |
104.90 |
103.45 - 104.90 |
3.7531 times |

DMA SMA EMA moving averages of Goi Loan 759GS2026_GS
DMA (daily moving average) of Goi Loan 759GS2026_GS
| DMA period | DMA value | | 5 day DMA | 101.68 | | 12 day DMA | 101.33 | | 20 day DMA | 101.39 | | 35 day DMA | 101.79 | | 50 day DMA | 101.9 | | 100 day DMA | 102.72 | | 150 day DMA | 102.49 | | 200 day DMA | 103.06 | EMA (exponential moving average) of Goi Loan 759GS2026_GS
| EMA period | EMA current | EMA prev | EMA prev2 | | 5 day EMA | 101.72 | 101.33 | 101.34 | | 12 day EMA | 101.52 | 101.34 | 101.35 | | 20 day EMA | 101.55 | 101.45 | 101.47 | | 35 day EMA | 101.74 | 101.7 | 101.72 | | 50 day EMA | 102.06 | 102.04 | 102.07 |
SMA (simple moving average) of Goi Loan 759GS2026_GS
| SMA period | SMA current | SMA prev | SMA prev2 | | 5 day SMA | 101.68 | 101.38 | 101.32 | | 12 day SMA | 101.33 | 101.22 | 101.16 | | 20 day SMA | 101.39 | 101.49 | 101.53 | | 35 day SMA | 101.79 | 101.78 | 101.79 | | 50 day SMA | 101.9 | 101.93 | 101.98 | | 100 day SMA | 102.72 | 102.71 | 102.72 | | 150 day SMA | 102.49 | 102.48 | 102.49 | | 200 day SMA | 103.06 | 103.12 | 103.18 |
|
|
