GoiLoan 754GS2036_GS full analysis,charts,indicators,moving averages,SMA,DMA,EMA,ADX,MACD,RSIGoi Loan 754GS2036_GS WideScreen charts, DMA,SMA,EMA technical analysis, forecast prediction, by indicators ADX,MACD,RSI,CCI NSE stock exchange
Daily price and charts and targets GoiLoan Strong Daily Stock price targets for GoiLoan 754GS2036_GS are 109.53 and 109.78 | Daily Target 1 | 109.35 | | Daily Target 2 | 109.46 | | Daily Target 3 | 109.60333333333 | | Daily Target 4 | 109.71 | | Daily Target 5 | 109.85 |
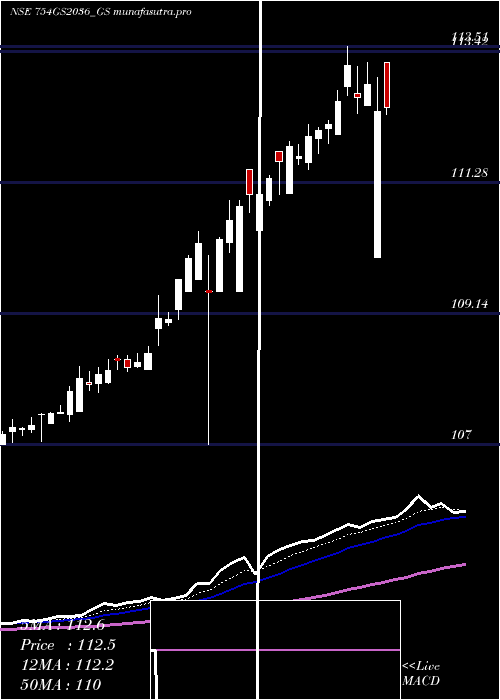
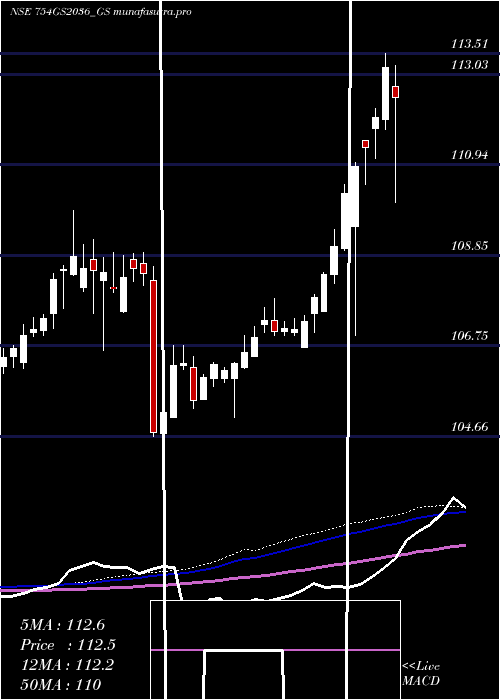
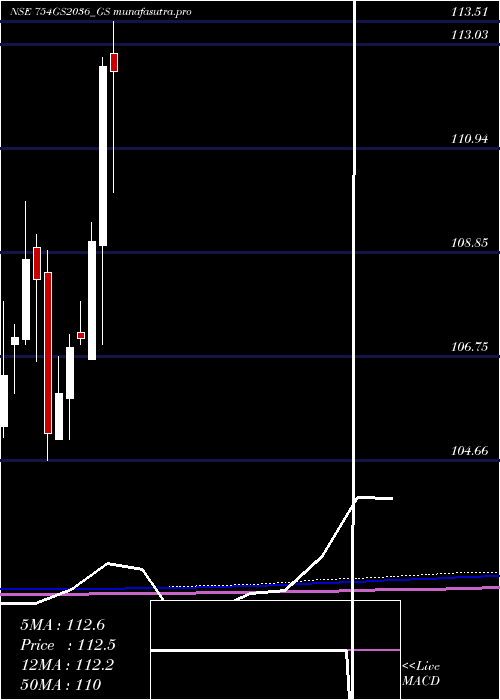
Daily price and volume Goi Loan
| Date |
Closing |
Open |
Range |
Volume |
Wed 29 October 2025 |
109.56 (0.11%) |
109.54 |
109.50 - 109.75 |
1.3797 times |
Tue 28 October 2025 |
109.44 (-0.05%) |
109.85 |
109.10 - 109.85 |
1.4098 times |
Mon 27 October 2025 |
109.50 (-0.26%) |
110.00 |
109.49 - 110.00 |
1.3086 times |
Fri 24 October 2025 |
109.79 (0.17%) |
109.95 |
109.51 - 109.95 |
0.5657 times |
Thu 23 October 2025 |
109.60 (-0.05%) |
110.00 |
109.40 - 110.00 |
2.2619 times |
Tue 21 October 2025 |
109.66 (0.15%) |
109.53 |
109.53 - 109.79 |
0.0454 times |
Mon 20 October 2025 |
109.50 (-0.17%) |
109.40 |
109.10 - 109.79 |
1.0521 times |
Fri 17 October 2025 |
109.69 (-0.02%) |
109.50 |
109.50 - 109.85 |
0.468 times |
Thu 16 October 2025 |
109.71 (-0.02%) |
109.75 |
109.51 - 109.79 |
0.631 times |
Wed 15 October 2025 |
109.73 (0.37%) |
109.32 |
109.30 - 110.00 |
0.8778 times |
Tue 14 October 2025 |
109.33 (-0.07%) |
109.60 |
107.00 - 109.68 |
0.6219 times |
Weekly price and charts GoiLoan Strong weekly Stock price targets for GoiLoan 754GS2036_GS are 108.88 and 109.78 | Weekly Target 1 | 108.65 | | Weekly Target 2 | 109.11 | | Weekly Target 3 | 109.55333333333 | | Weekly Target 4 | 110.01 | | Weekly Target 5 | 110.45 |
Weekly price and volumes for Goi Loan
| Date |
Closing |
Open |
Range |
Volume |
Wed 29 October 2025 |
109.56 (-0.21%) |
110.00 |
109.10 - 110.00 |
0.7563 times |
Fri 24 October 2025 |
109.79 (0.09%) |
109.40 |
109.10 - 110.00 |
0.7244 times |
Fri 17 October 2025 |
109.69 (0.35%) |
109.60 |
107.00 - 110.00 |
0.5967 times |
Fri 10 October 2025 |
109.31 (0.14%) |
109.40 |
107.00 - 109.60 |
0.8213 times |
Fri 03 October 2025 |
109.16 (0.4%) |
108.90 |
108.45 - 109.50 |
0.9767 times |
Fri 26 September 2025 |
108.72 (-0.11%) |
106.11 |
106.11 - 109.61 |
0.8278 times |
Fri 19 September 2025 |
108.84 (0.22%) |
108.51 |
108.45 - 108.90 |
1.1494 times |
Fri 12 September 2025 |
108.60 (0.29%) |
108.21 |
108.20 - 108.80 |
1.8075 times |
Fri 05 September 2025 |
108.29 (0.23%) |
108.80 |
107.81 - 109.20 |
1.4434 times |
Fri 29 August 2025 |
108.04 (0.29%) |
107.61 |
107.01 - 110.38 |
0.8966 times |
Fri 22 August 2025 |
107.73 (-0.42%) |
107.51 |
107.46 - 108.50 |
0.9137 times |
Monthly price and charts GoiLoan Strong monthly Stock price targets for GoiLoan 754GS2036_GS are 108.28 and 111.28 | Monthly Target 1 | 105.85 | | Monthly Target 2 | 107.71 | | Monthly Target 3 | 108.85333333333 | | Monthly Target 4 | 110.71 | | Monthly Target 5 | 111.85 |
Monthly price and volumes Goi Loan
| Date |
Closing |
Open |
Range |
Volume |
Wed 29 October 2025 |
109.56 (0.98%) |
108.99 |
107.00 - 110.00 |
0.6432 times |
Tue 30 September 2025 |
108.50 (0.43%) |
108.80 |
106.11 - 109.61 |
1.1114 times |
Fri 29 August 2025 |
108.04 (-1.08%) |
109.68 |
105.30 - 110.38 |
0.9369 times |
Thu 31 July 2025 |
109.22 (-0.32%) |
109.22 |
108.65 - 110.40 |
1.2668 times |
Mon 30 June 2025 |
109.57 (-0.62%) |
110.65 |
107.80 - 113.53 |
1.2413 times |
Fri 30 May 2025 |
110.25 (-2.09%) |
112.85 |
109.30 - 113.51 |
1.0761 times |
Wed 30 April 2025 |
112.60 (3.25%) |
109.00 |
107.00 - 112.78 |
1.0689 times |
Fri 28 March 2025 |
109.06 (1.81%) |
106.70 |
106.70 - 109.44 |
0.8278 times |
Fri 28 February 2025 |
107.12 (0.18%) |
107.25 |
107.00 - 107.85 |
0.7461 times |
Fri 31 January 2025 |
106.93 (0.88%) |
105.90 |
105.08 - 107.20 |
1.0815 times |
Tue 31 December 2024 |
106.00 (0.76%) |
105.08 |
105.08 - 106.75 |
0.9242 times |
DMA SMA EMA moving averages of Goi Loan 754GS2036_GS
DMA (daily moving average) of Goi Loan 754GS2036_GS
| DMA period | DMA value | | 5 day DMA | 109.58 | | 12 day DMA | 109.58 | | 20 day DMA | 109.37 | | 35 day DMA | 109.09 | | 50 day DMA | 108.75 | | 100 day DMA | 108.97 | | 150 day DMA | 109.64 | | 200 day DMA | 108.96 | EMA (exponential moving average) of Goi Loan 754GS2036_GS
| EMA period | EMA current | EMA prev | EMA prev2 | | 5 day EMA | 109.55 | 109.55 | 109.61 | | 12 day EMA | 109.5 | 109.49 | 109.5 | | 20 day EMA | 109.37 | 109.35 | 109.34 | | 35 day EMA | 109.12 | 109.09 | 109.07 | | 50 day EMA | 108.83 | 108.8 | 108.77 |
SMA (simple moving average) of Goi Loan 754GS2036_GS
| SMA period | SMA current | SMA prev | SMA prev2 | | 5 day SMA | 109.58 | 109.6 | 109.61 | | 12 day SMA | 109.58 | 109.56 | 109.54 | | 20 day SMA | 109.37 | 109.33 | 109.29 | | 35 day SMA | 109.09 | 109.07 | 109.03 | | 50 day SMA | 108.75 | 108.72 | 108.69 | | 100 day SMA | 108.97 | 108.98 | 108.98 | | 150 day SMA | 109.64 | 109.63 | 109.62 | | 200 day SMA | 108.96 | 108.95 | 108.93 |
|
|
