GoiLoan 74GS2062_GS full analysis,charts,indicators,moving averages,SMA,DMA,EMA,ADX,MACD,RSIGoi Loan 74GS2062_GS WideScreen charts, DMA,SMA,EMA technical analysis, forecast prediction, by indicators ADX,MACD,RSI,CCI NSE stock exchange
Daily price and charts and targets GoiLoan Strong Daily Stock price targets for GoiLoan 74GS2062_GS are 102.6 and 102.6 | Daily Target 1 | 102.6 | | Daily Target 2 | 102.6 | | Daily Target 3 | 102.6 | | Daily Target 4 | 102.6 | | Daily Target 5 | 102.6 |
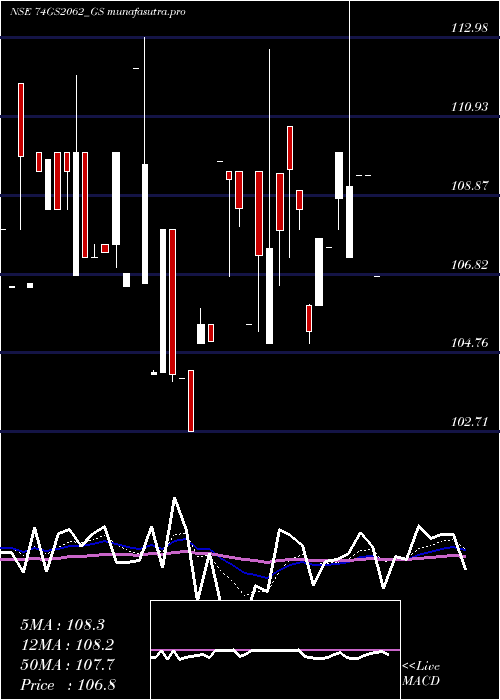
Daily price and volume Goi Loan
| Date |
Closing |
Open |
Range |
Volume |
Tue 28 October 2025 |
102.60 (-0.76%) |
102.60 |
102.60 - 102.60 |
0.4581 times |
Mon 27 October 2025 |
103.39 (-0.09%) |
103.45 |
100.00 - 103.50 |
2.1449 times |
Fri 24 October 2025 |
103.48 (1.3%) |
103.49 |
102.51 - 103.49 |
0.1246 times |
Thu 23 October 2025 |
102.15 (-1.4%) |
103.50 |
102.00 - 103.50 |
1.2141 times |
Tue 21 October 2025 |
103.60 (0.19%) |
103.60 |
103.60 - 103.60 |
0.0037 times |
Mon 20 October 2025 |
103.40 (0.49%) |
102.80 |
102.80 - 103.50 |
0.0811 times |
Fri 17 October 2025 |
102.90 (0.38%) |
102.99 |
102.90 - 103.25 |
3.8641 times |
Thu 16 October 2025 |
102.51 (-0.52%) |
103.10 |
102.00 - 103.10 |
0.9844 times |
Wed 15 October 2025 |
103.05 (0.05%) |
103.00 |
103.00 - 103.05 |
0.0467 times |
Tue 14 October 2025 |
103.00 (0%) |
102.50 |
102.30 - 103.00 |
1.0783 times |
Mon 13 October 2025 |
103.00 (0.02%) |
102.99 |
102.11 - 103.50 |
4.378 times |
Weekly price and charts GoiLoan Strong weekly Stock price targets for GoiLoan 74GS2062_GS are 99.55 and 103.05 | Weekly Target 1 | 98.53 | | Weekly Target 2 | 100.57 | | Weekly Target 3 | 102.03333333333 | | Weekly Target 4 | 104.07 | | Weekly Target 5 | 105.53 |
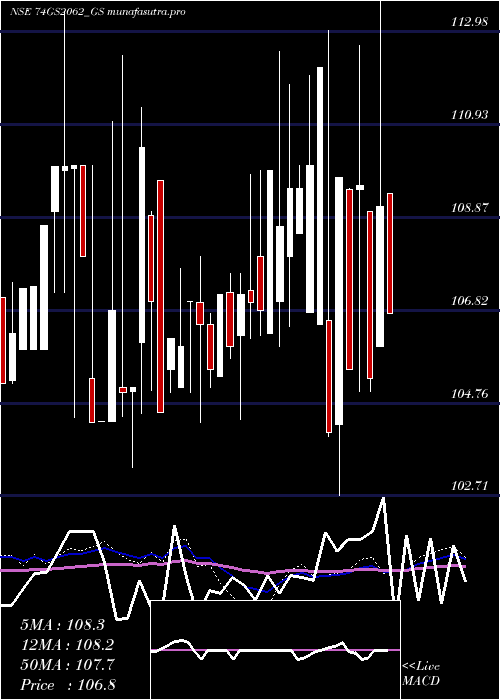
Weekly price and volumes for Goi Loan
| Date |
Closing |
Open |
Range |
Volume |
Tue 28 October 2025 |
102.60 (-0.85%) |
103.45 |
100.00 - 103.50 |
0.1954 times |
Fri 24 October 2025 |
103.48 (0.56%) |
102.80 |
102.00 - 103.60 |
0.1069 times |
Fri 17 October 2025 |
102.90 (-0.08%) |
102.99 |
102.00 - 103.50 |
0.7772 times |
Fri 10 October 2025 |
102.98 (1.65%) |
101.50 |
100.00 - 102.99 |
0.9594 times |
Fri 03 October 2025 |
101.31 (0.31%) |
101.00 |
98.76 - 103.83 |
0.8268 times |
Fri 26 September 2025 |
101.00 (0.49%) |
97.99 |
97.99 - 103.52 |
1.7958 times |
Fri 19 September 2025 |
100.51 (-3.77%) |
104.99 |
100.51 - 104.99 |
0.89 times |
Fri 12 September 2025 |
104.45 (0.42%) |
101.40 |
101.40 - 105.00 |
1.9742 times |
Fri 05 September 2025 |
104.01 (0.98%) |
103.60 |
102.50 - 105.25 |
1.4516 times |
Fri 29 August 2025 |
103.00 (-1.61%) |
105.00 |
102.50 - 105.25 |
1.0227 times |
Fri 22 August 2025 |
104.69 (-0.44%) |
103.50 |
103.50 - 105.50 |
0.4037 times |
Monthly price and charts GoiLoan Strong monthly Stock price targets for GoiLoan 74GS2062_GS are 100.68 and 105.75 | Monthly Target 1 | 96.66 | | Monthly Target 2 | 99.63 | | Monthly Target 3 | 101.73 | | Monthly Target 4 | 104.7 | | Monthly Target 5 | 106.8 |
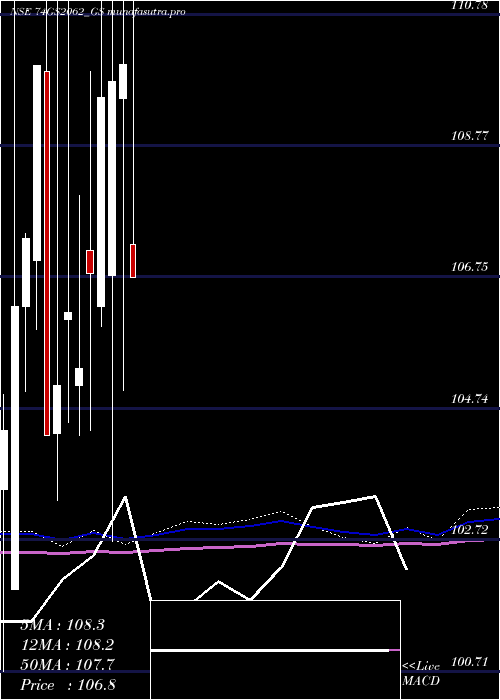
Monthly price and volumes Goi Loan
| Date |
Closing |
Open |
Range |
Volume |
Tue 28 October 2025 |
102.60 (1.47%) |
101.80 |
98.76 - 103.83 |
0.6895 times |
Tue 30 September 2025 |
101.11 (-1.83%) |
103.60 |
97.99 - 105.25 |
2.1383 times |
Fri 29 August 2025 |
103.00 (-3.28%) |
107.00 |
102.50 - 107.00 |
1.0907 times |
Thu 31 July 2025 |
106.49 (0.17%) |
106.55 |
105.02 - 108.45 |
3.4133 times |
Mon 30 June 2025 |
106.31 (-2.74%) |
106.50 |
104.51 - 109.00 |
1.8579 times |
Thu 29 May 2025 |
109.30 (-0.64%) |
107.25 |
106.75 - 114.98 |
0.0585 times |
Thu 24 April 2025 |
110.00 (0.23%) |
109.49 |
105.01 - 112.67 |
0.1905 times |
Fri 28 March 2025 |
109.75 (0.23%) |
106.77 |
102.71 - 113.00 |
0.2073 times |
Thu 27 February 2025 |
109.50 (2.52%) |
106.30 |
106.00 - 112.52 |
0.1837 times |
Fri 31 January 2025 |
106.81 (1.39%) |
107.15 |
104.40 - 109.90 |
0.1702 times |
Tue 31 December 2024 |
105.35 (-0.8%) |
105.10 |
104.33 - 108.00 |
0.1426 times |
DMA SMA EMA moving averages of Goi Loan 74GS2062_GS
DMA (daily moving average) of Goi Loan 74GS2062_GS
| DMA period | DMA value | | 5 day DMA | 103.04 | | 12 day DMA | 103.01 | | 20 day DMA | 102.49 | | 35 day DMA | 102.58 | | 50 day DMA | 103.02 | | 100 day DMA | 104.91 | | 150 day DMA | 105.88 | | 200 day DMA | 106.14 | EMA (exponential moving average) of Goi Loan 74GS2062_GS
| EMA period | EMA current | EMA prev | EMA prev2 | | 5 day EMA | 102.97 | 103.16 | 103.05 | | 12 day EMA | 102.86 | 102.91 | 102.82 | | 20 day EMA | 102.75 | 102.77 | 102.71 | | 35 day EMA | 102.99 | 103.01 | 102.99 | | 50 day EMA | 103.22 | 103.25 | 103.24 |
SMA (simple moving average) of Goi Loan 74GS2062_GS
| SMA period | SMA current | SMA prev | SMA prev2 | | 5 day SMA | 103.04 | 103.2 | 103.11 | | 12 day SMA | 103.01 | 102.96 | 102.87 | | 20 day SMA | 102.49 | 102.41 | 102.29 | | 35 day SMA | 102.58 | 102.62 | 102.63 | | 50 day SMA | 103.02 | 103.06 | 103.09 | | 100 day SMA | 104.91 | 104.97 | 105.01 | | 150 day SMA | 105.88 | 105.93 | 105.96 | | 200 day SMA | 106.14 | 106.16 | 106.18 |
|
|
