GoiLoan 741GS2036_GS full analysis,charts,indicators,moving averages,SMA,DMA,EMA,ADX,MACD,RSIGoi Loan 741GS2036_GS WideScreen charts, DMA,SMA,EMA technical analysis, forecast prediction, by indicators ADX,MACD,RSI,CCI NSE stock exchange
Daily price and charts and targets GoiLoan Strong Daily Stock price targets for GoiLoan 741GS2036_GS are 106.7 and 106.71 | Daily Target 1 | 106.69 | | Daily Target 2 | 106.7 | | Daily Target 3 | 106.70333333333 | | Daily Target 4 | 106.71 | | Daily Target 5 | 106.71 |
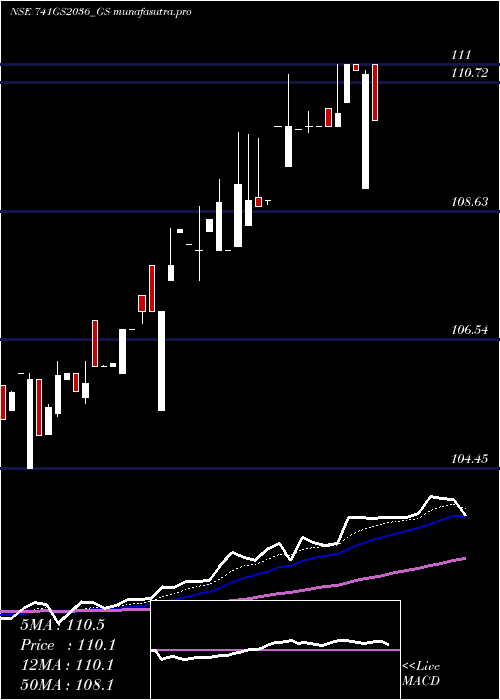
Daily price and volume Goi Loan
| Date |
Closing |
Open |
Range |
Volume |
Tue 28 October 2025 |
106.70 (-0.74%) |
106.71 |
106.70 - 106.71 |
1.1948 times |
Mon 27 October 2025 |
107.50 (0.46%) |
107.50 |
107.50 - 107.50 |
0.5106 times |
Fri 24 October 2025 |
107.01 (-0.78%) |
107.00 |
107.00 - 107.50 |
0.0715 times |
Mon 20 October 2025 |
107.85 (-0.1%) |
107.85 |
107.85 - 107.85 |
0.0949 times |
Fri 17 October 2025 |
107.96 (1.31%) |
106.90 |
106.90 - 107.99 |
2.4558 times |
Tue 14 October 2025 |
106.56 (-0.83%) |
106.61 |
106.55 - 107.50 |
0.1026 times |
Mon 13 October 2025 |
107.45 (0.65%) |
106.20 |
106.20 - 107.45 |
0.0153 times |
Fri 10 October 2025 |
106.76 (0.34%) |
107.00 |
106.76 - 107.00 |
2.798 times |
Thu 09 October 2025 |
106.40 (-0.75%) |
106.95 |
106.35 - 106.95 |
2.1546 times |
Wed 08 October 2025 |
107.20 (0.19%) |
107.25 |
106.50 - 107.30 |
0.602 times |
Tue 07 October 2025 |
107.00 (-1.02%) |
106.40 |
106.40 - 107.90 |
2.0745 times |
Weekly price and charts GoiLoan Strong weekly Stock price targets for GoiLoan 741GS2036_GS are 106.3 and 107.1 | Weekly Target 1 | 106.17 | | Weekly Target 2 | 106.43 | | Weekly Target 3 | 106.96666666667 | | Weekly Target 4 | 107.23 | | Weekly Target 5 | 107.77 |
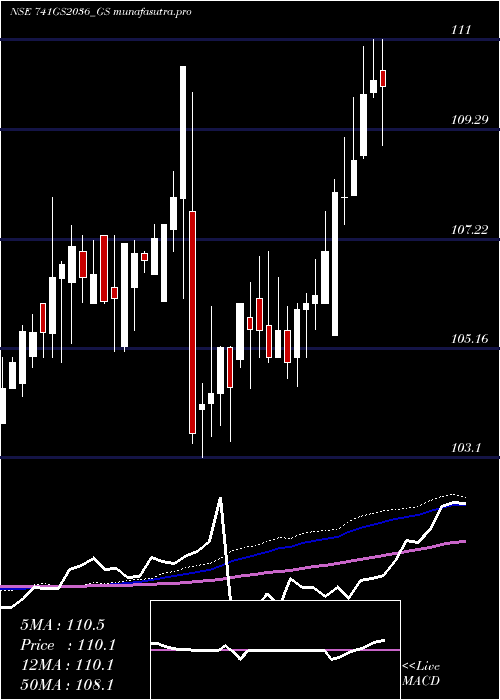
Weekly price and volumes for Goi Loan
| Date |
Closing |
Open |
Range |
Volume |
Tue 28 October 2025 |
106.70 (-0.29%) |
107.50 |
106.70 - 107.50 |
0.3006 times |
Fri 24 October 2025 |
107.01 (-0.88%) |
107.85 |
107.00 - 107.85 |
0.0293 times |
Fri 17 October 2025 |
107.96 (1.12%) |
106.20 |
106.20 - 107.99 |
0.4537 times |
Fri 10 October 2025 |
106.76 (-0.13%) |
106.70 |
106.35 - 108.10 |
1.5716 times |
Fri 03 October 2025 |
106.90 (-0.42%) |
107.34 |
105.80 - 107.34 |
2.3367 times |
Fri 26 September 2025 |
107.35 (-0.14%) |
104.81 |
104.81 - 107.40 |
0.1292 times |
Fri 19 September 2025 |
107.50 (1.22%) |
106.50 |
106.05 - 107.50 |
1.675 times |
Fri 12 September 2025 |
106.20 (0.03%) |
106.23 |
105.50 - 108.82 |
1.3524 times |
Fri 05 September 2025 |
106.17 (-0.39%) |
103.92 |
103.92 - 107.75 |
0.2756 times |
Fri 29 August 2025 |
106.59 (0.21%) |
106.37 |
104.00 - 106.99 |
1.8758 times |
Fri 22 August 2025 |
106.37 (0.07%) |
107.00 |
105.00 - 107.49 |
1.6098 times |
Monthly price and charts GoiLoan Strong monthly Stock price targets for GoiLoan 741GS2036_GS are 106.25 and 108.55 | Monthly Target 1 | 104.57 | | Monthly Target 2 | 105.63 | | Monthly Target 3 | 106.86666666667 | | Monthly Target 4 | 107.93 | | Monthly Target 5 | 109.17 |
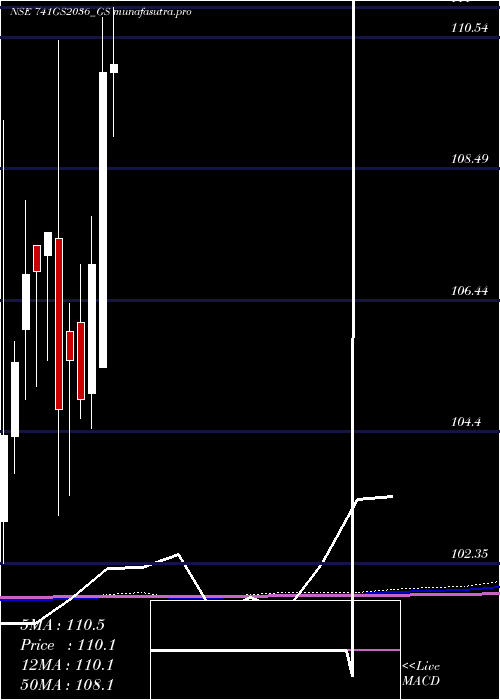
Monthly price and volumes Goi Loan
| Date |
Closing |
Open |
Range |
Volume |
Tue 28 October 2025 |
106.70 (0.41%) |
105.80 |
105.80 - 108.10 |
0.8509 times |
Tue 30 September 2025 |
106.26 (-0.31%) |
103.92 |
103.92 - 108.82 |
0.6718 times |
Fri 29 August 2025 |
106.59 (-0.43%) |
107.20 |
104.00 - 107.49 |
0.7648 times |
Thu 31 July 2025 |
107.05 (-1.11%) |
108.00 |
106.52 - 108.25 |
1.4763 times |
Fri 27 June 2025 |
108.25 (-3.13%) |
112.00 |
106.75 - 112.50 |
1.2186 times |
Fri 30 May 2025 |
111.75 (1.59%) |
110.00 |
109.00 - 112.10 |
1.333 times |
Wed 30 April 2025 |
110.00 (2.8%) |
105.40 |
105.40 - 110.85 |
1.0791 times |
Fri 28 March 2025 |
107.00 (2%) |
105.00 |
104.45 - 107.75 |
0.7343 times |
Fri 28 February 2025 |
104.90 (-0.58%) |
106.10 |
104.60 - 107.00 |
0.7188 times |
Fri 31 January 2025 |
105.51 (0.74%) |
105.95 |
103.40 - 106.40 |
1.1524 times |
Tue 31 December 2024 |
104.74 (-2.57%) |
107.41 |
103.10 - 110.49 |
0.8557 times |
DMA SMA EMA moving averages of Goi Loan 741GS2036_GS
DMA (daily moving average) of Goi Loan 741GS2036_GS
| DMA period | DMA value | | 5 day DMA | 107.4 | | 12 day DMA | 107.21 | | 20 day DMA | 107 | | 35 day DMA | 106.91 | | 50 day DMA | 106.83 | | 100 day DMA | 107.95 | | 150 day DMA | 108.01 | | 200 day DMA | 107.35 | EMA (exponential moving average) of Goi Loan 741GS2036_GS
| EMA period | EMA current | EMA prev | EMA prev2 | | 5 day EMA | 107.15 | 107.37 | 107.3 | | 12 day EMA | 107.12 | 107.2 | 107.15 | | 20 day EMA | 107.04 | 107.08 | 107.04 | | 35 day EMA | 106.96 | 106.98 | 106.95 | | 50 day EMA | 106.9 | 106.91 | 106.89 |
SMA (simple moving average) of Goi Loan 741GS2036_GS
| SMA period | SMA current | SMA prev | SMA prev2 | | 5 day SMA | 107.4 | 107.38 | 107.37 | | 12 day SMA | 107.21 | 107.22 | 107.13 | | 20 day SMA | 107 | 106.98 | 106.98 | | 35 day SMA | 106.91 | 106.91 | 106.88 | | 50 day SMA | 106.83 | 106.84 | 106.82 | | 100 day SMA | 107.95 | 108 | 108.04 | | 150 day SMA | 108.01 | 108 | 107.98 | | 200 day SMA | 107.35 | 107.35 | 107.36 |
|
|
