740 740IIFCL33_N1 full analysis,charts,indicators,moving averages,SMA,DMA,EMA,ADX,MACD,RSI7 40 740IIFCL33_N1 WideScreen charts, DMA,SMA,EMA technical analysis, forecast prediction, by indicators ADX,MACD,RSI,CCI NSE stock exchange
Daily price and charts and targets 740 Strong Daily Stock price targets for 740 740IIFCL33_N1 are 1195 and 1195 | Daily Target 1 | 1195 | | Daily Target 2 | 1195 | | Daily Target 3 | 1195 | | Daily Target 4 | 1195 | | Daily Target 5 | 1195 |
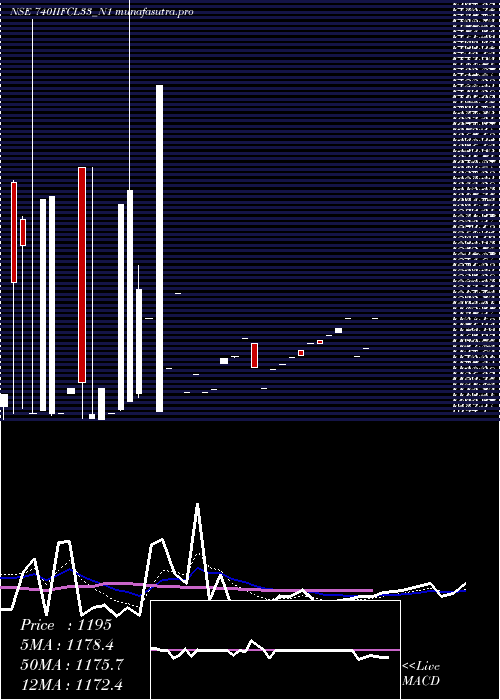
Daily price and volume 7 40
| Date |
Closing |
Open |
Range |
Volume |
Tue 09 December 2025 |
1195.00 (2.58%) |
1195.00 |
1195.00 - 1195.00 |
0.0232 times |
Fri 05 December 2025 |
1165.00 (0.69%) |
1165.00 |
1165.00 - 1165.00 |
0.029 times |
Wed 03 December 2025 |
1157.00 (-3.18%) |
1157.00 |
1157.00 - 1157.00 |
0.5794 times |
Thu 20 November 2025 |
1195.00 (0.84%) |
1195.00 |
1195.00 - 1195.00 |
0.0579 times |
Wed 19 November 2025 |
1185.00 (0.59%) |
1181.30 |
1181.30 - 1185.00 |
2.3465 times |
Thu 06 November 2025 |
1178.00 (0.63%) |
1178.00 |
1178.00 - 1178.00 |
2.8969 times |
Mon 13 October 2025 |
1170.61 (0.05%) |
1173.00 |
1170.61 - 1173.00 |
0.2723 times |
Wed 08 October 2025 |
1170.00 (1.03%) |
1170.00 |
1170.00 - 1170.00 |
2.8969 times |
Fri 03 October 2025 |
1158.10 (0.17%) |
1163.00 |
1158.10 - 1163.00 |
0.1159 times |
Mon 22 September 2025 |
1156.10 (0.65%) |
1156.10 |
1156.10 - 1156.10 |
0.7822 times |
Thu 31 July 2025 |
1148.63 (0.39%) |
1148.63 |
1148.63 - 1148.63 |
5.7937 times |
Weekly price and charts 740 Strong weekly Stock price targets for 740 740IIFCL33_N1 are 1195 and 1195 | Weekly Target 1 | 1195 | | Weekly Target 2 | 1195 | | Weekly Target 3 | 1195 | | Weekly Target 4 | 1195 | | Weekly Target 5 | 1195 |
Weekly price and volumes for 7 40
| Date |
Closing |
Open |
Range |
Volume |
Tue 09 December 2025 |
1195.00 (2.58%) |
1195.00 |
1195.00 - 1195.00 |
0.0049 times |
Fri 05 December 2025 |
1165.00 (-2.51%) |
1157.00 |
1157.00 - 1165.00 |
0.1282 times |
Thu 20 November 2025 |
1195.00 (1.44%) |
1181.30 |
1181.30 - 1195.00 |
0.5065 times |
Thu 06 November 2025 |
1178.00 (0.68%) |
1173.00 |
1170.61 - 1178.00 |
0.6676 times |
Wed 08 October 2025 |
1170.00 (1.03%) |
1170.00 |
1170.00 - 1170.00 |
0.6103 times |
Fri 03 October 2025 |
1158.10 (0.82%) |
1156.10 |
1156.10 - 1163.00 |
0.1892 times |
Thu 31 July 2025 |
1148.63 (2.07%) |
1144.22 |
1144.22 - 1148.63 |
1.2572 times |
Wed 25 June 2025 |
1125.37 (-1.82%) |
1125.37 |
1125.37 - 1125.37 |
0.2441 times |
Wed 18 June 2025 |
1146.25 (-0.97%) |
1175.00 |
1146.25 - 1175.00 |
1.5355 times |
Fri 06 June 2025 |
1157.50 (3.25%) |
1124.10 |
1124.10 - 1157.50 |
4.8566 times |
Mon 19 May 2025 |
1121.10 (-1.58%) |
1121.10 |
1121.10 - 1121.10 |
0.5578 times |

Monthly price and charts 740 Strong monthly Stock price targets for 740 740IIFCL33_N1 are 1176 and 1214 | Monthly Target 1 | 1144.33 | | Monthly Target 2 | 1169.67 | | Monthly Target 3 | 1182.3333333333 | | Monthly Target 4 | 1207.67 | | Monthly Target 5 | 1220.33 |
Monthly price and volumes 7 40
| Date |
Closing |
Open |
Range |
Volume |
Tue 09 December 2025 |
1195.00 (0%) |
1157.00 |
1157.00 - 1195.00 |
0.037 times |
Thu 20 November 2025 |
1195.00 (2.08%) |
1178.00 |
1178.00 - 1195.00 |
0.3107 times |
Mon 13 October 2025 |
1170.61 (1.26%) |
1163.00 |
1158.10 - 1173.00 |
0.1925 times |
Mon 22 September 2025 |
1156.10 (0.65%) |
1156.10 |
1156.10 - 1156.10 |
0.0458 times |
Thu 31 July 2025 |
1148.63 (0.39%) |
1148.63 |
1148.63 - 1148.63 |
0.3396 times |
Mon 30 June 2025 |
1144.22 (1.79%) |
1149.99 |
1125.37 - 1175.00 |
1.8225 times |
Mon 26 May 2025 |
1124.10 (-7.94%) |
1121.10 |
1121.10 - 1139.10 |
0.2129 times |
Thu 24 April 2025 |
1221.01 (-14.67%) |
1145.10 |
1145.10 - 1221.01 |
0.0516 times |
Thu 20 March 2025 |
1431.00 (30.09%) |
1104.00 |
1102.00 - 1565.00 |
2.6474 times |
Thu 27 February 2025 |
1100.00 (-10.67%) |
1295.00 |
1094.10 - 1497.00 |
4.3399 times |
Fri 31 January 2025 |
1231.44 (-8.1%) |
1600.00 |
1094.10 - 1600.00 |
1.3094 times |

DMA SMA EMA moving averages of 7 40 740IIFCL33_N1
DMA (daily moving average) of 7 40 740IIFCL33_N1
| DMA period | DMA value | | 5 day DMA | 1179.4 | | 12 day DMA | 1168.56 | | 20 day DMA | 1158.33 | | 35 day DMA | 1175.33 | | 50 day DMA | 1186.13 | | 100 day DMA | | | 150 day DMA | | | 200 day DMA | | EMA (exponential moving average) of 7 40 740IIFCL33_N1
| EMA period | EMA current | EMA prev | EMA prev2 | | 5 day EMA | 1178.43 | 1170.15 | 1172.73 | | 12 day EMA | 1172.43 | 1168.33 | 1168.94 | | 20 day EMA | 1171.91 | 1169.48 | 1169.95 | | 35 day EMA | 1175.12 | 1173.95 | 1174.48 | | 50 day EMA | 1184.46 | 1184.03 | 1184.81 |
SMA (simple moving average) of 7 40 740IIFCL33_N1
| SMA period | SMA current | SMA prev | SMA prev2 | | 5 day SMA | 1179.4 | 1176 | 1177.12 | | 12 day SMA | 1168.56 | 1162.75 | 1161.19 | | 20 day SMA | 1158.33 | 1154.63 | 1157.43 | | 35 day SMA | 1175.33 | 1178.76 | 1176.9 | | 50 day SMA | 1186.13 | 1185.63 | 1185.73 | | 100 day SMA | | 150 day SMA | | 200 day SMA |
|
|
