GoiLoan 73GS2053_GS full analysis,charts,indicators,moving averages,SMA,DMA,EMA,ADX,MACD,RSIGoi Loan 73GS2053_GS WideScreen charts, DMA,SMA,EMA technical analysis, forecast prediction, by indicators ADX,MACD,RSI,CCI NSE stock exchange
Daily price and charts and targets GoiLoan Strong Daily Stock price targets for GoiLoan 73GS2053_GS are 102.79 and 104.13 | Daily Target 1 | 102.43 | | Daily Target 2 | 103.15 | | Daily Target 3 | 103.77333333333 | | Daily Target 4 | 104.49 | | Daily Target 5 | 105.11 |
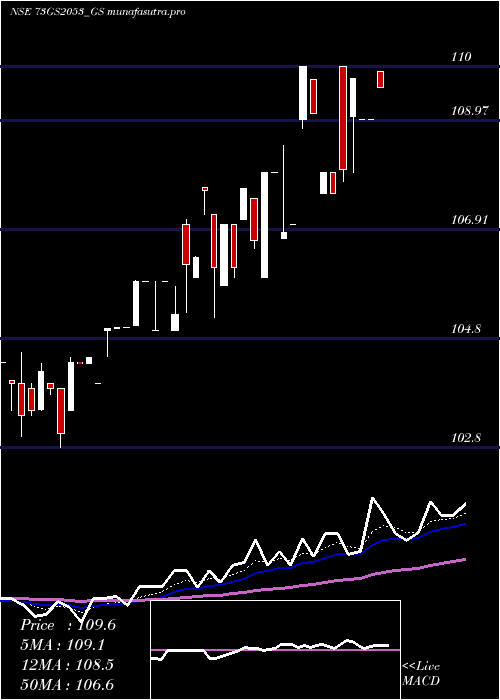
Daily price and volume Goi Loan
| Date |
Closing |
Open |
Range |
Volume |
Mon 27 October 2025 |
103.86 (-0.61%) |
104.10 |
103.06 - 104.40 |
5.4714 times |
Fri 24 October 2025 |
104.50 (-0.48%) |
104.00 |
104.00 - 105.00 |
0.0831 times |
Thu 23 October 2025 |
105.00 (-1.18%) |
105.00 |
105.00 - 105.00 |
0.031 times |
Tue 21 October 2025 |
106.25 (1.24%) |
106.25 |
106.25 - 106.25 |
0 times |
Mon 20 October 2025 |
104.95 (-0.52%) |
106.25 |
104.00 - 106.25 |
0.1405 times |
Fri 17 October 2025 |
105.50 (0.38%) |
104.50 |
104.50 - 105.50 |
0.0505 times |
Thu 16 October 2025 |
105.10 (0.92%) |
104.20 |
104.20 - 105.10 |
1.5122 times |
Wed 15 October 2025 |
104.14 (-0.31%) |
103.50 |
103.50 - 104.80 |
1.5563 times |
Tue 14 October 2025 |
104.46 (0.01%) |
103.86 |
103.85 - 104.46 |
0.0751 times |
Mon 13 October 2025 |
104.45 (0.42%) |
103.60 |
103.00 - 104.45 |
1.08 times |
Fri 10 October 2025 |
104.01 (0.25%) |
103.95 |
103.85 - 104.09 |
0.0503 times |
Weekly price and charts GoiLoan Strong weekly Stock price targets for GoiLoan 73GS2053_GS are 102.79 and 104.13 | Weekly Target 1 | 102.43 | | Weekly Target 2 | 103.15 | | Weekly Target 3 | 103.77333333333 | | Weekly Target 4 | 104.49 | | Weekly Target 5 | 105.11 |
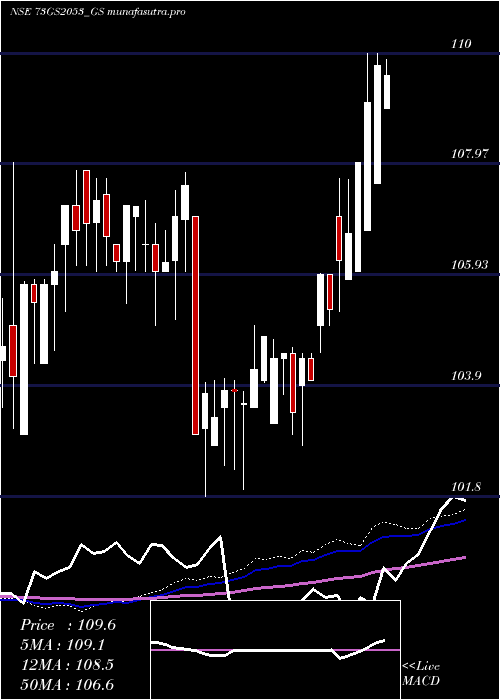
Weekly price and volumes for Goi Loan
| Date |
Closing |
Open |
Range |
Volume |
Mon 27 October 2025 |
103.86 (-0.61%) |
104.10 |
103.06 - 104.40 |
4.5187 times |
Fri 24 October 2025 |
104.50 (-0.95%) |
106.25 |
104.00 - 106.25 |
0.2103 times |
Fri 17 October 2025 |
105.50 (1.43%) |
103.60 |
103.00 - 105.50 |
3.5298 times |
Fri 10 October 2025 |
104.01 (0.91%) |
104.09 |
102.46 - 104.70 |
1.0669 times |
Fri 03 October 2025 |
103.07 (0.56%) |
104.20 |
102.00 - 104.94 |
0.0657 times |
Fri 26 September 2025 |
102.50 (-1.25%) |
102.12 |
102.05 - 103.90 |
0.0212 times |
Fri 19 September 2025 |
103.80 (0.87%) |
102.15 |
102.10 - 104.00 |
0.0025 times |
Fri 12 September 2025 |
102.90 (-1.01%) |
106.20 |
102.00 - 106.20 |
0.2519 times |
Fri 05 September 2025 |
103.95 (1.91%) |
102.00 |
101.60 - 103.95 |
0.1252 times |
Fri 29 August 2025 |
102.00 (-1.45%) |
103.60 |
100.26 - 103.60 |
0.2079 times |
Fri 22 August 2025 |
103.50 (-0.48%) |
102.96 |
100.55 - 104.44 |
0.0975 times |
Monthly price and charts GoiLoan Strong monthly Stock price targets for GoiLoan 73GS2053_GS are 103.16 and 106.95 | Monthly Target 1 | 100.4 | | Monthly Target 2 | 102.13 | | Monthly Target 3 | 104.19 | | Monthly Target 4 | 105.92 | | Monthly Target 5 | 107.98 |
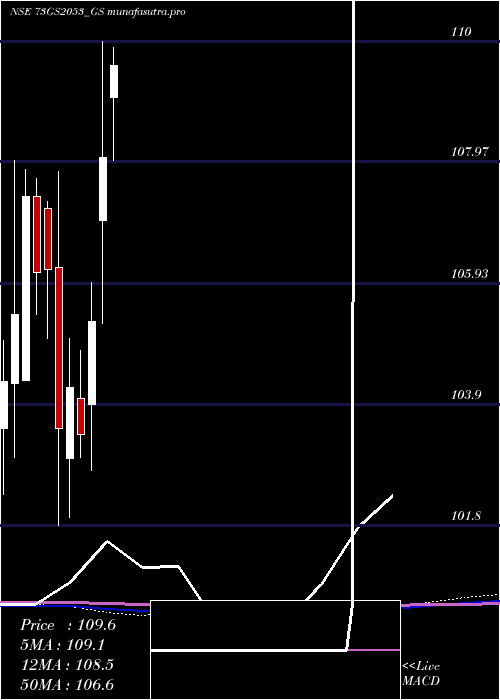
Monthly price and volumes Goi Loan
| Date |
Closing |
Open |
Range |
Volume |
Mon 27 October 2025 |
103.86 (0.83%) |
103.34 |
102.46 - 106.25 |
5.3163 times |
Tue 30 September 2025 |
103.00 (0.98%) |
102.00 |
101.60 - 106.20 |
0.2428 times |
Fri 29 August 2025 |
102.00 (-1.41%) |
104.00 |
100.26 - 108.99 |
0.3681 times |
Mon 28 July 2025 |
103.46 (-0.74%) |
104.25 |
103.01 - 105.74 |
0.1519 times |
Mon 30 June 2025 |
104.23 (-3.78%) |
108.70 |
103.50 - 110.04 |
1.1591 times |
Fri 30 May 2025 |
108.33 (0.26%) |
109.05 |
107.26 - 109.89 |
0.0655 times |
Wed 30 April 2025 |
108.05 (2.61%) |
107.00 |
105.26 - 110.00 |
0.6215 times |
Fri 28 March 2025 |
105.30 (1.84%) |
103.90 |
102.80 - 105.95 |
0.3425 times |
Fri 28 February 2025 |
103.40 (-0.77%) |
104.00 |
103.01 - 104.80 |
0.4618 times |
Fri 31 January 2025 |
104.20 (0.68%) |
103.00 |
102.00 - 105.00 |
1.2706 times |
Tue 31 December 2024 |
103.50 (-2.51%) |
106.20 |
101.86 - 107.80 |
1.2996 times |
DMA SMA EMA moving averages of Goi Loan 73GS2053_GS
DMA (daily moving average) of Goi Loan 73GS2053_GS
| DMA period | DMA value | | 5 day DMA | 104.91 | | 12 day DMA | 104.66 | | 20 day DMA | 104.02 | | 35 day DMA | 103.56 | | 50 day DMA | 103.53 | | 100 day DMA | 104.56 | | 150 day DMA | 104.89 | | 200 day DMA | 104.86 | EMA (exponential moving average) of Goi Loan 73GS2053_GS
| EMA period | EMA current | EMA prev | EMA prev2 | | 5 day EMA | 104.6 | 104.97 | 105.21 | | 12 day EMA | 104.52 | 104.64 | 104.66 | | 20 day EMA | 104.23 | 104.27 | 104.25 | | 35 day EMA | 104 | 104.01 | 103.98 | | 50 day EMA | 103.73 | 103.72 | 103.69 |
SMA (simple moving average) of Goi Loan 73GS2053_GS
| SMA period | SMA current | SMA prev | SMA prev2 | | 5 day SMA | 104.91 | 105.24 | 105.36 | | 12 day SMA | 104.66 | 104.66 | 104.58 | | 20 day SMA | 104.02 | 103.97 | 103.85 | | 35 day SMA | 103.56 | 103.5 | 103.43 | | 50 day SMA | 103.53 | 103.55 | 103.55 | | 100 day SMA | 104.56 | 104.62 | 104.65 | | 150 day SMA | 104.89 | 104.9 | 104.9 | | 200 day SMA | 104.86 | 104.87 | 104.88 |
|
|
