GoiLoan 738GS2027_GS full analysis,charts,indicators,moving averages,SMA,DMA,EMA,ADX,MACD,RSIGoi Loan 738GS2027_GS WideScreen charts, DMA,SMA,EMA technical analysis, forecast prediction, by indicators ADX,MACD,RSI,CCI NSE stock exchange
Daily price and charts and targets GoiLoan Strong Daily Stock price targets for GoiLoan 738GS2027_GS are 105.06 and 105.17 | Daily Target 1 | 105.03 | | Daily Target 2 | 105.07 | | Daily Target 3 | 105.14 | | Daily Target 4 | 105.18 | | Daily Target 5 | 105.25 |
Daily price and volume Goi Loan
| Date |
Closing |
Open |
Range |
Volume |
Tue 28 October 2025 |
105.11 (-0.15%) |
105.11 |
105.10 - 105.21 |
1.221 times |
Mon 27 October 2025 |
105.27 (0.16%) |
105.39 |
105.00 - 105.39 |
3.1069 times |
Fri 24 October 2025 |
105.10 (0.09%) |
105.05 |
104.91 - 105.10 |
0.0552 times |
Thu 23 October 2025 |
105.01 (-0.28%) |
105.20 |
104.81 - 105.20 |
1.9956 times |
Tue 21 October 2025 |
105.30 (0.08%) |
105.20 |
104.25 - 105.30 |
0.5654 times |
Mon 20 October 2025 |
105.22 (0.16%) |
102.42 |
102.42 - 105.30 |
0.6994 times |
Fri 17 October 2025 |
105.05 (0.08%) |
104.90 |
104.90 - 105.05 |
0.3482 times |
Thu 16 October 2025 |
104.97 (-0.03%) |
105.12 |
104.95 - 105.12 |
0.1527 times |
Wed 15 October 2025 |
105.00 (0.13%) |
104.86 |
104.81 - 105.13 |
0.3602 times |
Tue 14 October 2025 |
104.86 (-0.23%) |
104.41 |
104.00 - 105.10 |
1.4953 times |
Mon 13 October 2025 |
105.10 (0.11%) |
104.95 |
104.90 - 105.11 |
0.5368 times |
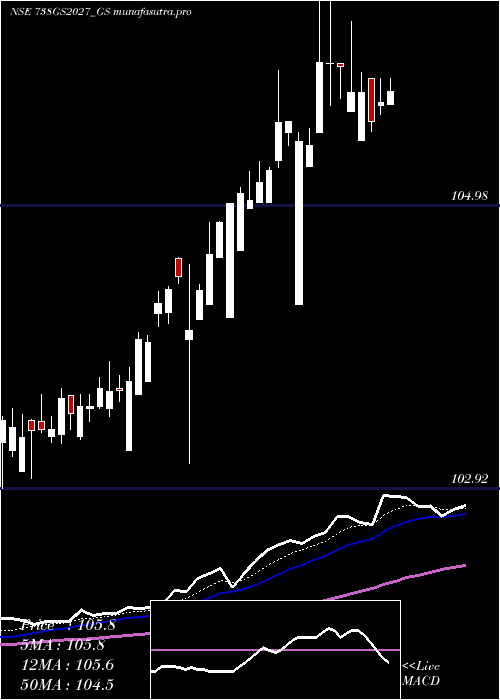
Weekly price and charts GoiLoan Strong weekly Stock price targets for GoiLoan 738GS2027_GS are 104.86 and 105.25 | Weekly Target 1 | 104.78 | | Weekly Target 2 | 104.94 | | Weekly Target 3 | 105.16666666667 | | Weekly Target 4 | 105.33 | | Weekly Target 5 | 105.56 |
Weekly price and volumes for Goi Loan
| Date |
Closing |
Open |
Range |
Volume |
Tue 28 October 2025 |
105.11 (0.01%) |
105.39 |
105.00 - 105.39 |
0.8746 times |
Fri 24 October 2025 |
105.10 (0.05%) |
102.42 |
102.42 - 105.30 |
0.67 times |
Fri 17 October 2025 |
105.05 (0.07%) |
104.95 |
104.00 - 105.13 |
0.5846 times |
Fri 10 October 2025 |
104.98 (0.21%) |
104.79 |
102.24 - 105.04 |
0.9155 times |
Fri 03 October 2025 |
104.76 (0.23%) |
104.37 |
104.26 - 104.81 |
0.9342 times |
Fri 26 September 2025 |
104.52 (0.22%) |
104.25 |
104.25 - 104.66 |
0.9593 times |
Fri 19 September 2025 |
104.29 (-0.02%) |
104.35 |
104.10 - 104.51 |
1.0792 times |
Fri 12 September 2025 |
104.31 (0.31%) |
104.01 |
103.80 - 104.40 |
0.6468 times |
Fri 05 September 2025 |
103.99 (0.07%) |
103.92 |
103.65 - 104.45 |
0.9004 times |
Fri 29 August 2025 |
103.92 (0.15%) |
104.20 |
103.50 - 104.20 |
2.4354 times |
Fri 22 August 2025 |
103.76 (-0.31%) |
104.02 |
103.25 - 104.59 |
3.413 times |

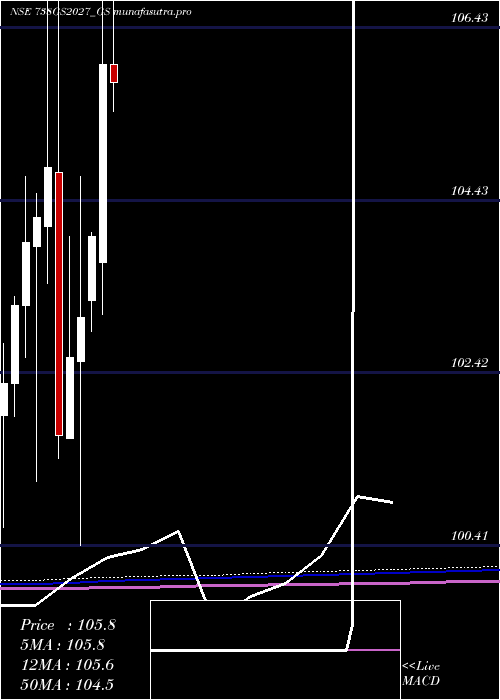
Monthly price and charts GoiLoan Strong monthly Stock price targets for GoiLoan 738GS2027_GS are 103.68 and 106.83 | Monthly Target 1 | 101.1 | | Monthly Target 2 | 103.1 | | Monthly Target 3 | 104.24666666667 | | Monthly Target 4 | 106.25 | | Monthly Target 5 | 107.4 |
Monthly price and volumes Goi Loan
| Date |
Closing |
Open |
Range |
Volume |
Tue 28 October 2025 |
105.11 (0.63%) |
104.50 |
102.24 - 105.39 |
0.5362 times |
Tue 30 September 2025 |
104.45 (0.51%) |
103.92 |
103.65 - 104.66 |
0.5082 times |
Fri 29 August 2025 |
103.92 (0.17%) |
103.44 |
102.85 - 104.90 |
1.0446 times |
Thu 31 July 2025 |
103.74 (0.49%) |
104.00 |
100.84 - 104.00 |
1.0796 times |
Mon 30 June 2025 |
103.23 (-3.27%) |
106.80 |
102.75 - 108.40 |
1.1238 times |
Fri 30 May 2025 |
106.72 (0.67%) |
106.00 |
103.48 - 107.80 |
0.967 times |
Wed 30 April 2025 |
106.01 (1.93%) |
103.70 |
103.10 - 106.85 |
1.3191 times |
Fri 28 March 2025 |
104.00 (0.91%) |
103.25 |
102.90 - 104.05 |
0.768 times |
Fri 28 February 2025 |
103.06 (0.45%) |
102.55 |
100.41 - 104.70 |
1.0977 times |
Fri 31 January 2025 |
102.60 (0.9%) |
101.65 |
101.65 - 104.00 |
1.5559 times |
Tue 31 December 2024 |
101.68 (-2.99%) |
104.75 |
101.41 - 107.08 |
2.9335 times |
DMA SMA EMA moving averages of Goi Loan 738GS2027_GS
DMA (daily moving average) of Goi Loan 738GS2027_GS
| DMA period | DMA value | | 5 day DMA | 105.16 | | 12 day DMA | 105.08 | | 20 day DMA | 104.94 | | 35 day DMA | 104.67 | | 50 day DMA | 104.45 | | 100 day DMA | 104.32 | | 150 day DMA | 104.64 | | 200 day DMA | 104.14 | EMA (exponential moving average) of Goi Loan 738GS2027_GS
| EMA period | EMA current | EMA prev | EMA prev2 | | 5 day EMA | 105.14 | 105.16 | 105.1 | | 12 day EMA | 105.05 | 105.04 | 105 | | 20 day EMA | 104.94 | 104.92 | 104.88 | | 35 day EMA | 104.72 | 104.7 | 104.67 | | 50 day EMA | 104.5 | 104.47 | 104.44 |
SMA (simple moving average) of Goi Loan 738GS2027_GS
| SMA period | SMA current | SMA prev | SMA prev2 | | 5 day SMA | 105.16 | 105.18 | 105.14 | | 12 day SMA | 105.08 | 105.07 | 105.03 | | 20 day SMA | 104.94 | 104.91 | 104.87 | | 35 day SMA | 104.67 | 104.64 | 104.6 | | 50 day SMA | 104.45 | 104.44 | 104.42 | | 100 day SMA | 104.32 | 104.33 | 104.35 | | 150 day SMA | 104.64 | 104.63 | 104.61 | | 200 day SMA | 104.14 | 104.12 | 104.1 |
|
|
