GoiLoan 737GS2028_GS full analysis,charts,indicators,moving averages,SMA,DMA,EMA,ADX,MACD,RSIGoi Loan 737GS2028_GS WideScreen charts, DMA,SMA,EMA technical analysis, forecast prediction, by indicators ADX,MACD,RSI,CCI NSE stock exchange
Daily price and charts and targets GoiLoan Strong Daily Stock price targets for GoiLoan 737GS2028_GS are 103.49 and 104.6 | Daily Target 1 | 102.61 | | Daily Target 2 | 103.25 | | Daily Target 3 | 103.71666666667 | | Daily Target 4 | 104.36 | | Daily Target 5 | 104.83 |
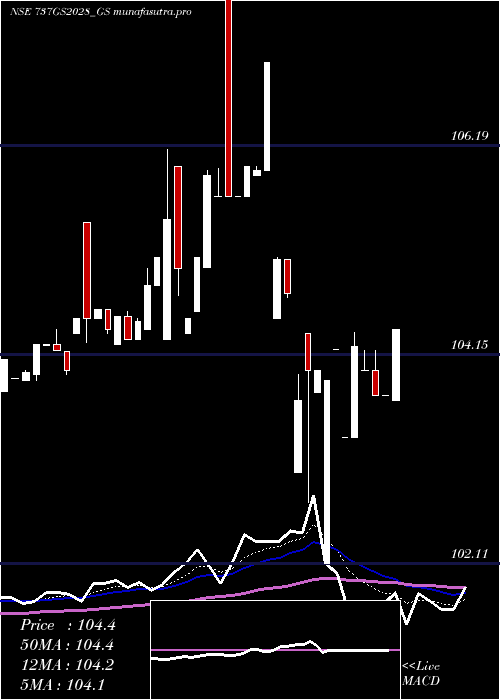
Daily price and volume Goi Loan
| Date |
Closing |
Open |
Range |
Volume |
Tue 28 October 2025 |
103.90 (0.81%) |
103.07 |
103.07 - 104.18 |
1.3629 times |
Mon 27 October 2025 |
103.07 (-0.17%) |
104.00 |
103.00 - 104.00 |
0.7044 times |
Fri 24 October 2025 |
103.25 (-0.76%) |
104.04 |
102.65 - 104.04 |
4.7323 times |
Thu 23 October 2025 |
104.04 (0.85%) |
104.40 |
103.70 - 104.40 |
0.1403 times |
Tue 21 October 2025 |
103.16 (-1%) |
104.00 |
103.16 - 104.00 |
0.0085 times |
Mon 20 October 2025 |
104.20 (-3.06%) |
106.00 |
104.20 - 106.00 |
0.5558 times |
Fri 17 October 2025 |
107.49 (0.4%) |
103.50 |
103.50 - 107.50 |
0.6884 times |
Thu 16 October 2025 |
107.06 (0.07%) |
107.70 |
106.62 - 107.70 |
0.9613 times |
Wed 15 October 2025 |
106.98 (1.31%) |
107.00 |
106.90 - 107.10 |
0.8376 times |
Tue 14 October 2025 |
105.60 (-0.38%) |
105.60 |
105.60 - 105.60 |
0.0085 times |
Mon 13 October 2025 |
106.00 (-0.57%) |
106.00 |
106.00 - 106.00 |
0.8623 times |
Weekly price and charts GoiLoan Strong weekly Stock price targets for GoiLoan 737GS2028_GS are 102.86 and 104.04 | Weekly Target 1 | 102.51 | | Weekly Target 2 | 103.21 | | Weekly Target 3 | 103.69333333333 | | Weekly Target 4 | 104.39 | | Weekly Target 5 | 104.87 |
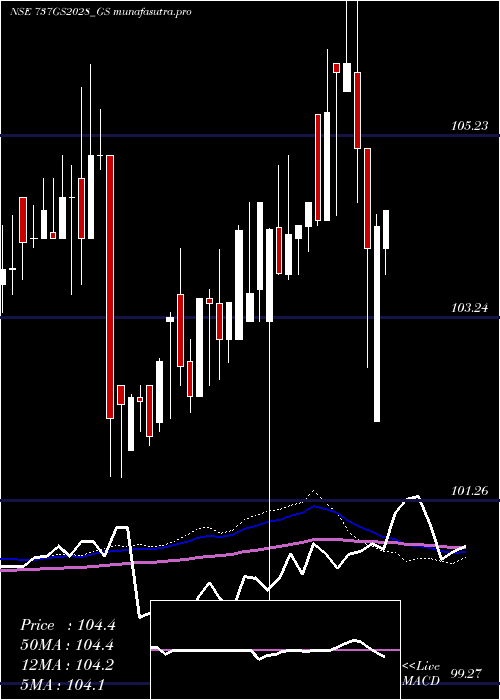
Weekly price and volumes for Goi Loan
| Date |
Closing |
Open |
Range |
Volume |
Tue 28 October 2025 |
103.90 (0.63%) |
104.00 |
103.00 - 104.18 |
0.9098 times |
Fri 24 October 2025 |
103.25 (-3.94%) |
106.00 |
102.65 - 106.00 |
2.3927 times |
Fri 17 October 2025 |
107.49 (0.83%) |
106.00 |
103.50 - 107.70 |
1.4779 times |
Fri 10 October 2025 |
106.61 (0.22%) |
106.56 |
105.60 - 107.65 |
0.4705 times |
Fri 03 October 2025 |
106.38 (-0.43%) |
106.00 |
105.00 - 106.40 |
2.2137 times |
Wed 24 September 2025 |
106.84 (0.98%) |
105.05 |
105.05 - 106.84 |
0.3902 times |
Fri 19 September 2025 |
105.80 (0.28%) |
105.05 |
105.05 - 106.75 |
0.4489 times |
Fri 12 September 2025 |
105.50 (-0.57%) |
105.05 |
105.05 - 106.10 |
1.0846 times |
Fri 05 September 2025 |
106.10 (1%) |
105.05 |
104.25 - 106.10 |
0.2969 times |
Fri 29 August 2025 |
105.05 (-0.33%) |
104.65 |
102.76 - 105.11 |
0.3148 times |
Fri 22 August 2025 |
105.40 (-1.12%) |
106.40 |
104.65 - 106.44 |
1.7095 times |
Monthly price and charts GoiLoan Strong monthly Stock price targets for GoiLoan 737GS2028_GS are 100.75 and 105.8 | Monthly Target 1 | 99.7 | | Monthly Target 2 | 101.8 | | Monthly Target 3 | 104.75 | | Monthly Target 4 | 106.85 | | Monthly Target 5 | 109.8 |
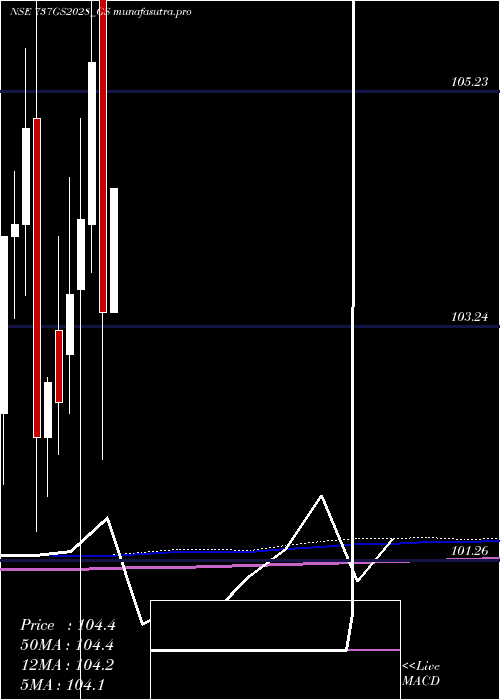
Monthly price and volumes Goi Loan
| Date |
Closing |
Open |
Range |
Volume |
Tue 28 October 2025 |
103.90 (-2.17%) |
105.60 |
102.65 - 107.70 |
0.4325 times |
Tue 30 September 2025 |
106.20 (1.09%) |
105.05 |
104.25 - 106.84 |
0.3529 times |
Fri 29 August 2025 |
105.05 (-0.28%) |
105.35 |
102.76 - 106.59 |
0.2397 times |
Thu 31 July 2025 |
105.35 (0.32%) |
105.50 |
104.75 - 106.00 |
0.2216 times |
Mon 30 June 2025 |
105.01 (0.34%) |
104.60 |
104.40 - 106.00 |
0.2635 times |
Fri 30 May 2025 |
104.65 (1.26%) |
103.35 |
103.21 - 106.40 |
0.4155 times |
Wed 30 April 2025 |
103.35 (-2.01%) |
106.00 |
102.11 - 107.82 |
0.8164 times |
Fri 28 March 2025 |
105.47 (1.28%) |
104.10 |
103.70 - 106.15 |
0.4414 times |
Fri 28 February 2025 |
104.14 (0.61%) |
103.55 |
99.27 - 105.00 |
0.254 times |
Fri 31 January 2025 |
103.51 (0.89%) |
103.00 |
102.50 - 104.50 |
6.5625 times |
Tue 31 December 2024 |
102.60 (-0.16%) |
103.20 |
102.15 - 104.00 |
0.7577 times |
DMA SMA EMA moving averages of Goi Loan 737GS2028_GS
DMA (daily moving average) of Goi Loan 737GS2028_GS
| DMA period | DMA value | | 5 day DMA | 103.48 | | 12 day DMA | 105.11 | | 20 day DMA | 105.67 | | 35 day DMA | 105.63 | | 50 day DMA | 105.47 | | 100 day DMA | 105.3 | | 150 day DMA | 105.05 | | 200 day DMA | 104.63 | EMA (exponential moving average) of Goi Loan 737GS2028_GS
| EMA period | EMA current | EMA prev | EMA prev2 | | 5 day EMA | 103.86 | 103.84 | 104.23 | | 12 day EMA | 104.69 | 104.83 | 105.15 | | 20 day EMA | 105.12 | 105.25 | 105.48 | | 35 day EMA | 105.33 | 105.41 | 105.55 | | 50 day EMA | 105.25 | 105.31 | 105.4 |
SMA (simple moving average) of Goi Loan 737GS2028_GS
| SMA period | SMA current | SMA prev | SMA prev2 | | 5 day SMA | 103.48 | 103.54 | 104.43 | | 12 day SMA | 105.11 | 105.31 | 105.62 | | 20 day SMA | 105.67 | 105.82 | 105.92 | | 35 day SMA | 105.63 | 105.66 | 105.69 | | 50 day SMA | 105.47 | 105.5 | 105.54 | | 100 day SMA | 105.3 | 105.31 | 105.32 | | 150 day SMA | 105.05 | 105.04 | 105.05 | | 200 day SMA | 104.63 | 104.62 | 104.63 |
|
|
