Tfb7 736NTPC25D_NB full analysis,charts,indicators,moving averages,SMA,DMA,EMA,ADX,MACD,RSITfb 7 736NTPC25D_NB WideScreen charts, DMA,SMA,EMA technical analysis, forecast prediction, by indicators ADX,MACD,RSI,CCI NSE stock exchange
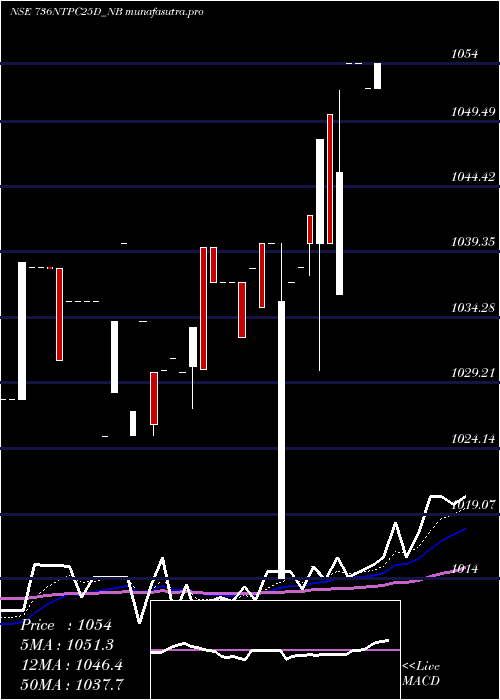
Daily price and charts and targets Tfb7 Strong Daily Stock price targets for Tfb7 736NTPC25D_NB are 1053 and 1054.99 | Daily Target 1 | 1051.34 | | Daily Target 2 | 1052.66 | | Daily Target 3 | 1053.3266666667 | | Daily Target 4 | 1054.65 | | Daily Target 5 | 1055.32 |
Daily price and volume Tfb 7
| Date |
Closing |
Open |
Range |
Volume |
Fri 23 May 2025 |
1053.99 (0.19%) |
1052.00 |
1052.00 - 1053.99 |
0.7801 times |
Tue 20 May 2025 |
1052.00 (-0.19%) |
1052.00 |
1052.00 - 1052.00 |
0.0767 times |
Mon 19 May 2025 |
1053.99 (-0%) |
1053.99 |
1053.99 - 1053.99 |
1.3171 times |
Mon 12 May 2025 |
1054.00 (0.81%) |
1054.00 |
1054.00 - 1054.00 |
0.3069 times |
Wed 07 May 2025 |
1045.50 (0.53%) |
1036.12 |
1036.12 - 1051.87 |
1.023 times |
Fri 02 May 2025 |
1040.00 (-0.76%) |
1050.00 |
1040.00 - 1050.00 |
0.6522 times |
Tue 22 April 2025 |
1048.00 (0.77%) |
1040.00 |
1030.12 - 1048.00 |
4.8849 times |
Mon 21 April 2025 |
1040.00 (0.18%) |
1042.18 |
1037.52 - 1042.18 |
0.0384 times |
Wed 16 April 2025 |
1038.15 (0.11%) |
1038.15 |
1038.15 - 1038.15 |
0.3197 times |
Tue 15 April 2025 |
1037.00 (0.14%) |
1037.00 |
1037.00 - 1037.00 |
0.601 times |
Fri 11 April 2025 |
1035.51 (-0.43%) |
1014.00 |
1014.00 - 1040.00 |
1.3811 times |
Weekly price and charts Tfb7 Strong weekly Stock price targets for Tfb7 736NTPC25D_NB are 1053 and 1054.99 | Weekly Target 1 | 1051.34 | | Weekly Target 2 | 1052.66 | | Weekly Target 3 | 1053.3266666667 | | Weekly Target 4 | 1054.65 | | Weekly Target 5 | 1055.32 |
Weekly price and volumes for Tfb 7
| Date |
Closing |
Open |
Range |
Volume |
Fri 23 May 2025 |
1053.99 (-0%) |
1053.99 |
1052.00 - 1053.99 |
0.7427 times |
Mon 12 May 2025 |
1054.00 (0.81%) |
1054.00 |
1054.00 - 1054.00 |
0.1048 times |
Wed 07 May 2025 |
1045.50 (0.53%) |
1036.12 |
1036.12 - 1051.87 |
0.3495 times |
Fri 02 May 2025 |
1040.00 (0.18%) |
1042.18 |
1030.12 - 1050.00 |
1.9048 times |
Wed 16 April 2025 |
1038.15 (0.25%) |
1037.00 |
1037.00 - 1038.15 |
0.3145 times |
Fri 11 April 2025 |
1035.51 (0.05%) |
1040.00 |
1014.00 - 1040.00 |
1.031 times |
Fri 04 April 2025 |
1035.00 (-0.19%) |
1037.00 |
1032.71 - 1040.00 |
1.2363 times |
Fri 28 March 2025 |
1037.00 (0%) |
1037.00 |
1037.00 - 1037.00 |
0.4412 times |
Thu 20 March 2025 |
1037.00 (0.34%) |
1039.69 |
1030.30 - 1039.70 |
0.8475 times |
Thu 13 March 2025 |
1033.50 (0.73%) |
1030.10 |
1027.25 - 1033.50 |
3.0275 times |
Fri 07 March 2025 |
1026.01 (-1.34%) |
1025.20 |
1025.20 - 1034.00 |
4.1852 times |
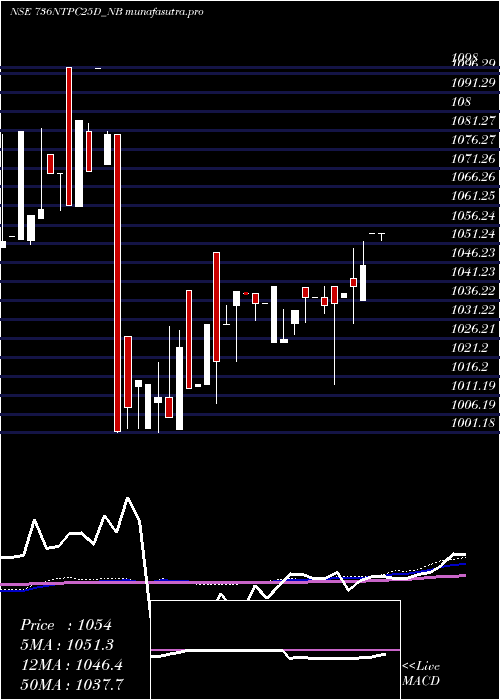
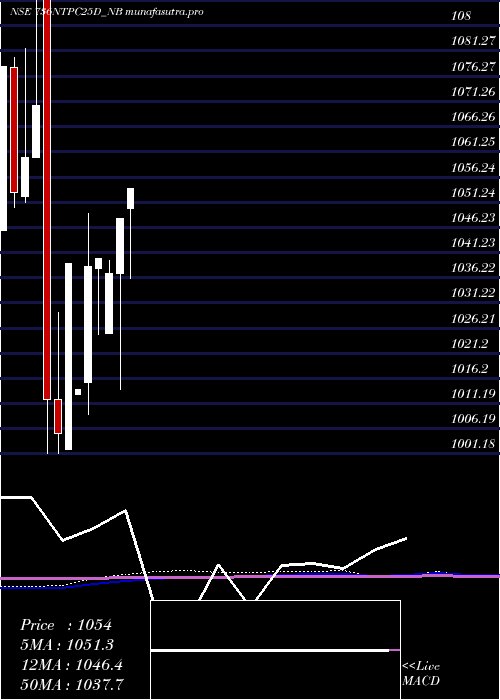
Monthly price and charts Tfb7 Strong monthly Stock price targets for Tfb7 736NTPC25D_NB are 1045.06 and 1062.94 | Monthly Target 1 | 1030.16 | | Monthly Target 2 | 1042.07 | | Monthly Target 3 | 1048.0366666667 | | Monthly Target 4 | 1059.95 | | Monthly Target 5 | 1065.92 |
Monthly price and volumes Tfb 7
| Date |
Closing |
Open |
Range |
Volume |
Fri 23 May 2025 |
1053.99 (0.57%) |
1050.00 |
1036.12 - 1054.00 |
0.385 times |
Tue 22 April 2025 |
1048.00 (1.06%) |
1037.00 |
1014.00 - 1048.00 |
1.1561 times |
Fri 28 March 2025 |
1037.00 (-0.29%) |
1025.20 |
1025.20 - 1039.70 |
2.3051 times |
Fri 28 February 2025 |
1039.99 (0.14%) |
1038.14 |
1025.01 - 1039.99 |
0.295 times |
Fri 31 January 2025 |
1038.54 (2.42%) |
1015.41 |
1009.13 - 1049.00 |
1.1739 times |
Tue 17 December 2024 |
1014.00 (-2.41%) |
1013.03 |
1013.03 - 1014.00 |
0.0734 times |
Thu 28 November 2024 |
1039.00 (3.35%) |
1002.20 |
1002.20 - 1039.00 |
0.3506 times |
Fri 25 October 2024 |
1005.31 (-0.65%) |
1011.90 |
1001.31 - 1029.38 |
2.0078 times |
Mon 30 September 2024 |
1011.90 (-5.47%) |
1097.59 |
1001.18 - 1097.59 |
1.4665 times |
Thu 29 August 2024 |
1070.51 (0.98%) |
1060.12 |
1060.12 - 1098.00 |
0.7865 times |
Tue 30 July 2024 |
1060.12 (0.66%) |
1052.39 |
1051.22 - 1081.77 |
1.2165 times |
DMA SMA EMA moving averages of Tfb 7 736NTPC25D_NB
DMA (daily moving average) of Tfb 7 736NTPC25D_NB
| DMA period | DMA value | | 5 day DMA | 1051.9 | | 12 day DMA | 1044.85 | | 20 day DMA | 1040.93 | | 35 day DMA | 1037.35 | | 50 day DMA | 1034.62 | | 100 day DMA | 1038.39 | | 150 day DMA | | | 200 day DMA | | EMA (exponential moving average) of Tfb 7 736NTPC25D_NB
| EMA period | EMA current | EMA prev | EMA prev2 | | 5 day EMA | 1051.27 | 1049.91 | 1048.86 | | 12 day EMA | 1046.37 | 1044.98 | 1043.7 | | 20 day EMA | 1042.81 | 1041.63 | 1040.54 | | 35 day EMA | 1038.62 | 1037.72 | 1036.88 | | 50 day EMA | 1035.23 | 1034.46 | 1033.74 |
SMA (simple moving average) of Tfb 7 736NTPC25D_NB
| SMA period | SMA current | SMA prev | SMA prev2 | | 5 day SMA | 1051.9 | 1049.1 | 1048.3 | | 12 day SMA | 1044.85 | 1043.26 | 1042.1 | | 20 day SMA | 1040.93 | 1039.73 | 1038.69 | | 35 day SMA | 1037.35 | 1036.9 | 1036.5 | | 50 day SMA | 1034.62 | 1033.82 | 1033.05 | | 100 day SMA | 1038.39 | 1038.66 | 1038.84 | | 150 day SMA | | 200 day SMA |
|
|
